This VA Secretary STILL Does NOT Get it

In fact Disney does care about wait lines, apparently he has not been to the theme park. While the FBI is overworked, it is high time to open criminal investigations into the Veterans Administration and the FOIA requests need to be flying, this is shameful and disgusting.

VA Secretary: Disney Doesn’t Care About Wait Times, Why Should the VA?

Mediaite: Secretary for Veterans Affairs Robert McDonald had an interesting take on the criticism of long wait times at VA facilities, arguing Monday that Disney theme parks aren’t judged based on their wait times.

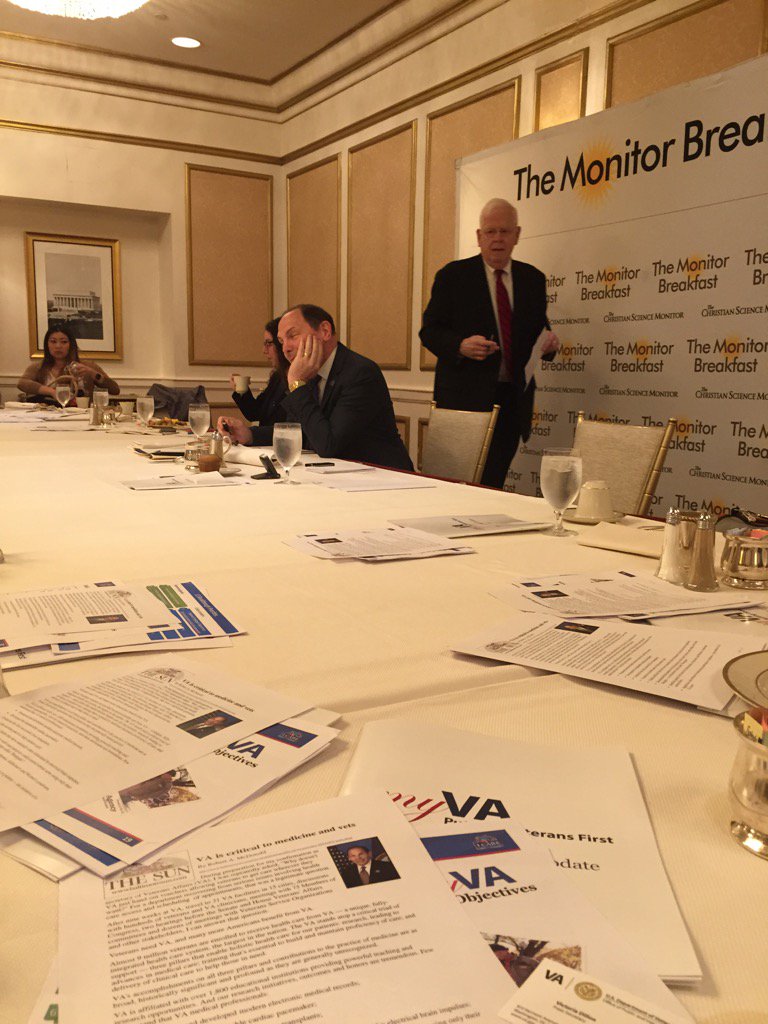
McDonald’s remarks, which were made during a breakfast event held by The Christian Science Monitor, started to gain attention after they were tweeted out by attendee Washington Examiner reporter Sarah Westwood.

“When you got to Disney, do they measure the number of hours you wait in line? Or what’s important? What’s important is, what’s your satisfaction with the experience?” McDonald said in the full quote. “And what I would like to move to, eventually, is that kind of measure.”

McDonald continued to say that the “create date” metric, which measures how long a veteran has to wait from the moment they first ask for care, is not a “valid measure” of wait time. Instead, he supports measuring wait times from how long veterans have to wait past their “preferred date” for care.

In 2014, an internal VA investigation found that at least 35 veterans in the Phoenix area died as a result of the long waiting times at the local VA hospital or after being secretly removed from the list entirely.

****

Examiner/Westwood: McDonald’s comments angered House Speaker Paul Ryan, who tweeted out Monday afternoon, “This is not make-believe, Mr. Secretary. Veterans have died waiting in those lines.”

McDonald faced questions at the breakfast about the VA’s lack of transparency surrounding how long veterans must wait to receive care at VA facilities around the country. The agency has weathered controversy over the past several years due to its struggle to provide timely care for many patients.

The VA secretary said most veterans report being satisfied with their care and argued that the average wait time for a veteran seeking VA treatment is only a matter of days.

He said he did not believe a measure called the “create date,” which gauges a veteran’s wait time by counting from the day the veteran first requests care, was a “valid measure” of a veteran’s VA experience.

The Government Accountability Office released a report in April exploring the metric used to count a veterans’ wait time, called the “preferred date.” The measure does not count from the time a veteran first calls to make an appointment.

****

Related: VA bosses in 7 states falsified vets’ wait times for care

The newly released findings of those probes show that supervisors instructed schedulers to manipulate wait times in Arkansas, California, Delaware, Illinois, New York, Texas and Vermont, giving the false impression facilities there were meeting VA performance measures for shorter wait times.

In some cases, the system encouraged manipulation even without explicit instruction from supervisors. A manager in West Palm Beach, Fla., sent out laudatory emails touting the shorter wait times the system showed. Schedulers in Harlingen, Texas, reported being berated by supervisors when they booked appointments showing longer wait times for veterans. (It was “not pretty,” one employee said.) More here.

******

Meanwhile, there is this heartwarming story:

Dying veteran’s horses visit him at hospital to say goodbye

Dying veteran's horses visit him at hospital to say goodbye

Quadrangle: We would like to thank Roberto Gonzales for his service and sacrifice.

As he lay dying in a Veterans Administration hospital he had one wish, to see his beloved horses Sugar and Ringo one last time.

Roberto Gonzales was wounded in battle on May 21, 1970. “He was in Vietnam for a few months when he was shot an injured”, explains his wife, Rosario Gonzalez.

Now, Gonzalez is paralyzed, restricted to a hospital bed and suffering from organ failure.

He recently went to the hospital for a wound on his back, which is when it was discovered he also needed treatment for liver problems and that his kidneys were starting to shut down.

“Horses are his life”, Rosario Gonzales told CNN affiliate KABB.

A paralysed and dying Vietnam War veteran has been reunited with his favourite horses in an emotional final wish.

The visit was also a testament to Roberto’s love of the animals, as both he and his wife trained and raised horses for almost 40 years together.

Two of those animals are Sugar and Ringo, a pair of horses that have become some of Gonzalez’s closest friends. “They came up to him and I think they were actually kissing him”.

 

Confused About the Middle East That Costs Us Billions?

You are not alone if foreign policy is either boring, confusing or just over there. Foreign policy is domestic policy given what we are forced to spend in money and human treasure to maintain some kind of equilibrium in the region. Under the Obama regime, the United States has backed off substantially and the reasons were explained in the Jeffrey Goldberg Atlantic article which was a VERY long read. However, it is important because war and political conflict began in the 70’s for the United States and has no end in sight as told by the intelligence experts due to militant Islam.
Fighting against Islam has been a centuries old condition and there is no forecast for any sort of resolution while treaties, accords and agreements have populated presidential administrations for decades.

We, in the West just cannot bail out and leave it to those ‘over there’ to deal with it all, as there are countless ramifications to that notion, and we are war weary. We are out of money and out of solutions. Do we stay the course in some form?

Below are some maps to help you understand better the entire region, the history and the dynamic of where the world is today. Maps are of great help and this should be a useful tool.

40 maps that explain the Middle East

by Max Fisher on March 26, 2015

Vox: Maps can be a powerful tool for understanding the world, particularly the Middle East, a place in many ways shaped by changing political borders and demographics. Here are 40 maps crucial for understanding the Middle East — its history, its present, and some of the most important stories in the region today.

Middle East History

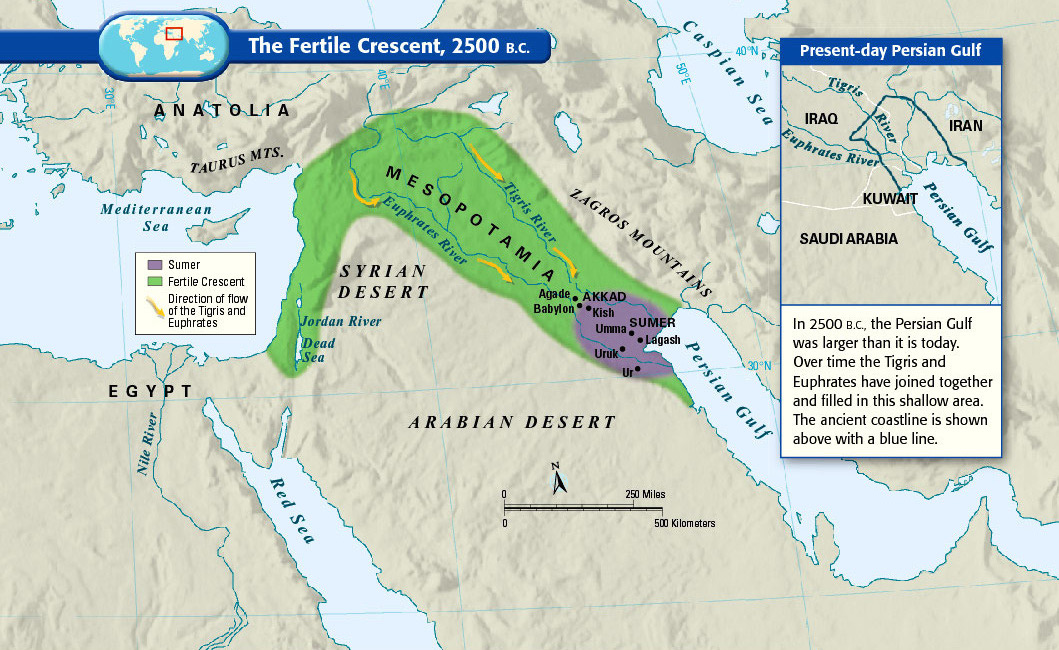
  1. The fertile crescent, the cradle of civilization

    The fertile crescent, the cradle of civilization

    If this area wasn’t the birthplace of human civilization, it was at least a birthplace of human civilization. Called “the fertile crescent” because of its lush soil, the “crescent” of land mostly includes modern-day Iraq, Syria, Jordan, and Israel-Palestine. (Some definitions also include the Nile River valley in Egypt.) People started farming here in 9000 BC, and by around 2500 BC the Sumerians formed the first complex society that resembles what we’d now call a “country,” complete with written laws and a political system. Put differently, there are more years between Sumerians and ancient Romans than there are between ancient Romans and us.

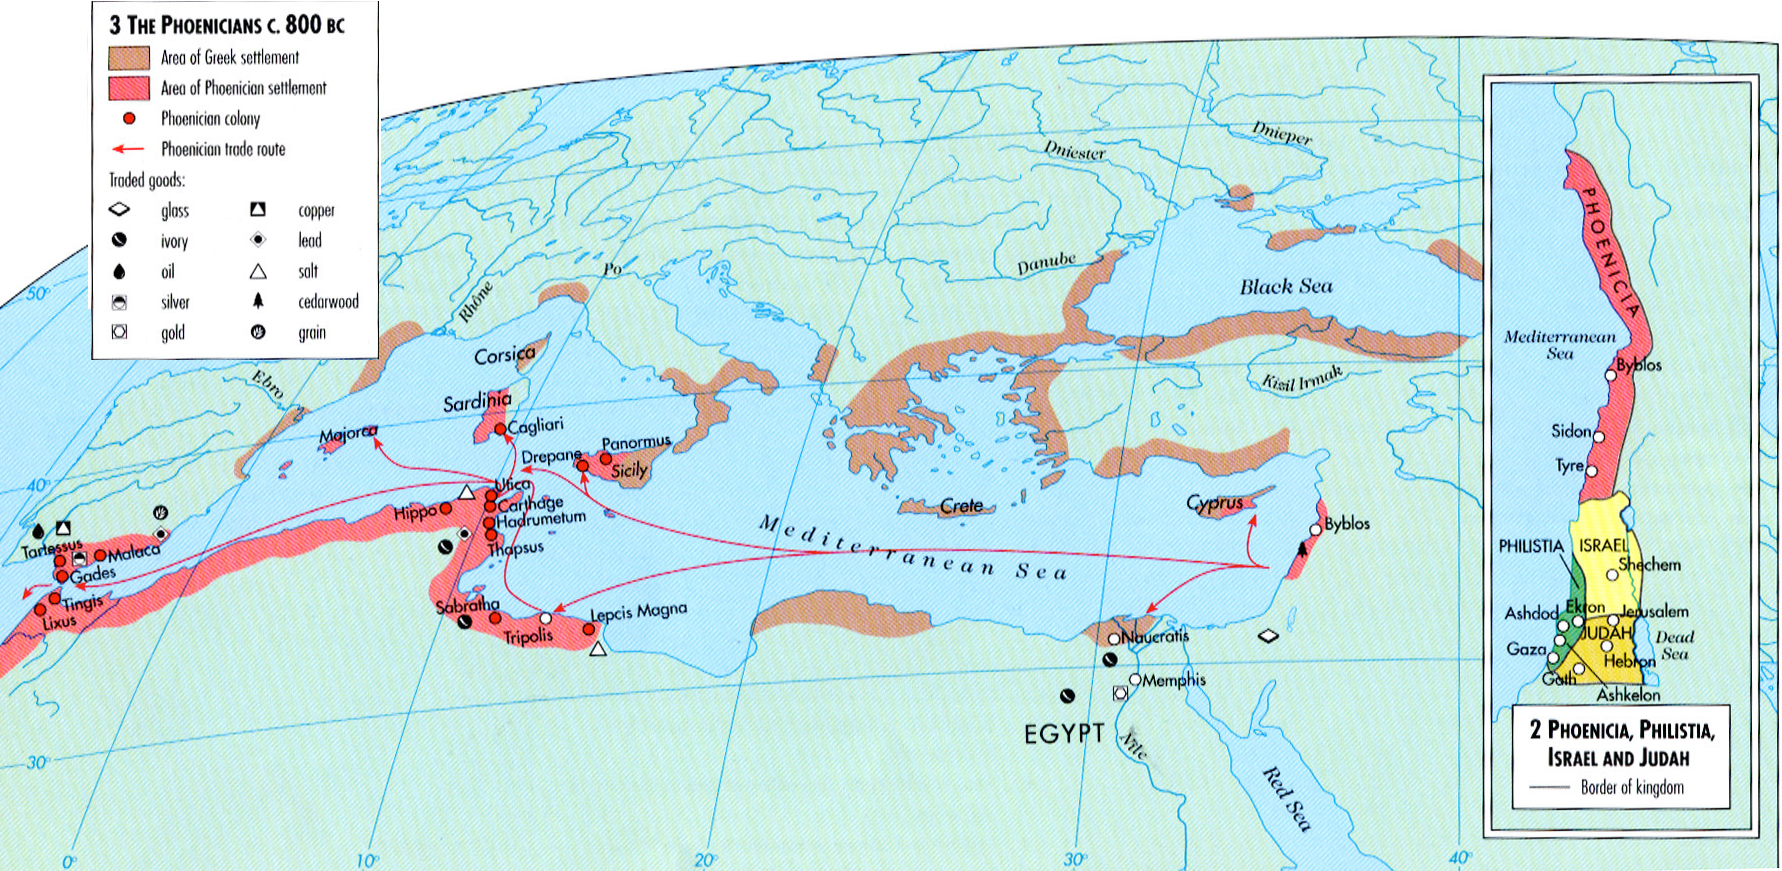
  2. How ancient Phoenicians spread from Lebanon across the Mediterranean

    How ancient Phoenicians spread from Lebanon across the Mediterranean

    The Phoenicians, who lived in present-day Lebanon and coastal Syria, were pretty awesome. From about 1500 to 300 BC, they ran some of the Mediterranean’s first big trading networks, shown in red, and dominated the sea along with the Greeks, who are shown in brown. Some sailed as far as the British Isles, and many of them set up colonies in North Africa, Spain, Sicily, and Sardinia. This was one of the first of many close cultural links between the Middle East and North Africa – and why Libya’s capital, Tripoli, still bears the name of the ancient Phoenician colony that established it.

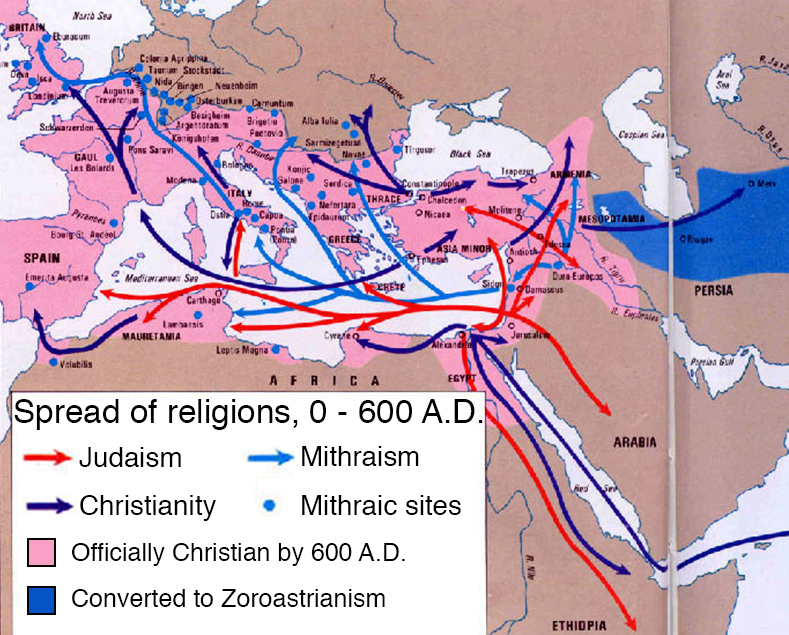
  3. How the Middle East gave Europe religion, three times

    How the Middle East gave Europe religion, three times

    The Middle East actually gave Europe religion four times, including Islam, but this map shows the first three. First was Judaism, which spread through natural immigration and when Romans forcibly dispersed the rebelling Israelites in the first and second century AD. In the first through third centuries A.D., a religion called Mithraism — sometimes called a “mystery religion” for its emphasis on secret rites and clandestine worship — spread from present-day Turkey or Armenia throughout the Roman Empire (at the time, most adherents believed it was from Persians in modern-day Iran, but this is probably wrong). Mithraism was completely replaced with Christianity, which became the Roman Empire’s official religion, after a few centuries. It’s easy to forget that, for centuries, Christianity was predominantly a religion of Middle Easterners, who in turn converted Europeans.

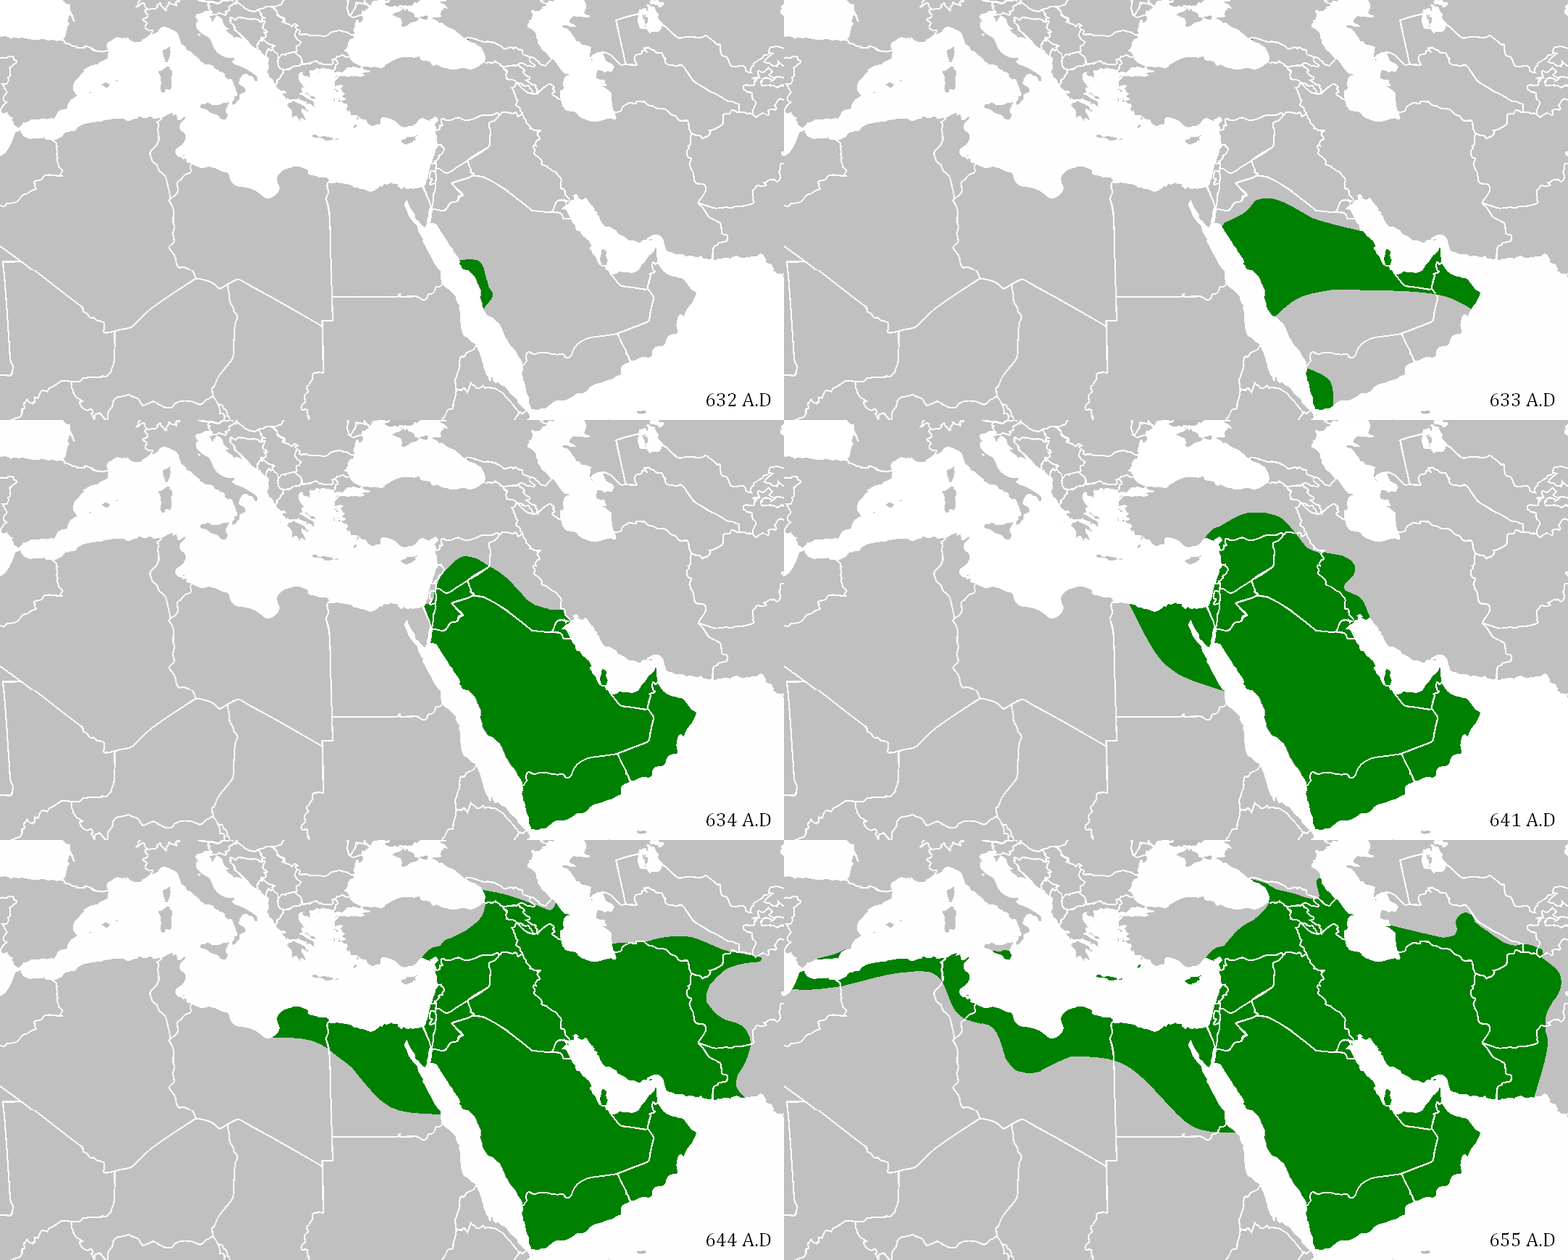
  4. When Mohammed’s Caliphate conquered the Middle East

    When Mohammed’s Caliphate conquered the Middle East

    In the early 7th century AD in present-day Saudi Arabia, the Prophet Mohammed founded Islam, which his followers considered a community as well as a religion. As they spread across the Arabian peninsula, they became an empire, which expanded just as the neighboring Persian and Byzantine Empires were ready to collapse. In an astonishingly short time — from Mohammed’s death in 632 to 652 AD — they managed to conquer the entire Middle East, North Africa, Persia, and parts of southern Europe. They spread Islam, the Arabic language, and the idea of a shared Middle Eastern identity — all of which still define the region today. It would be as if everyone in Europe still spoke Roman Latin and considered themselves ethnically Roman.

  5. A map of the world at the Caliphate’s height

    A map of the world at the Caliphate’s height

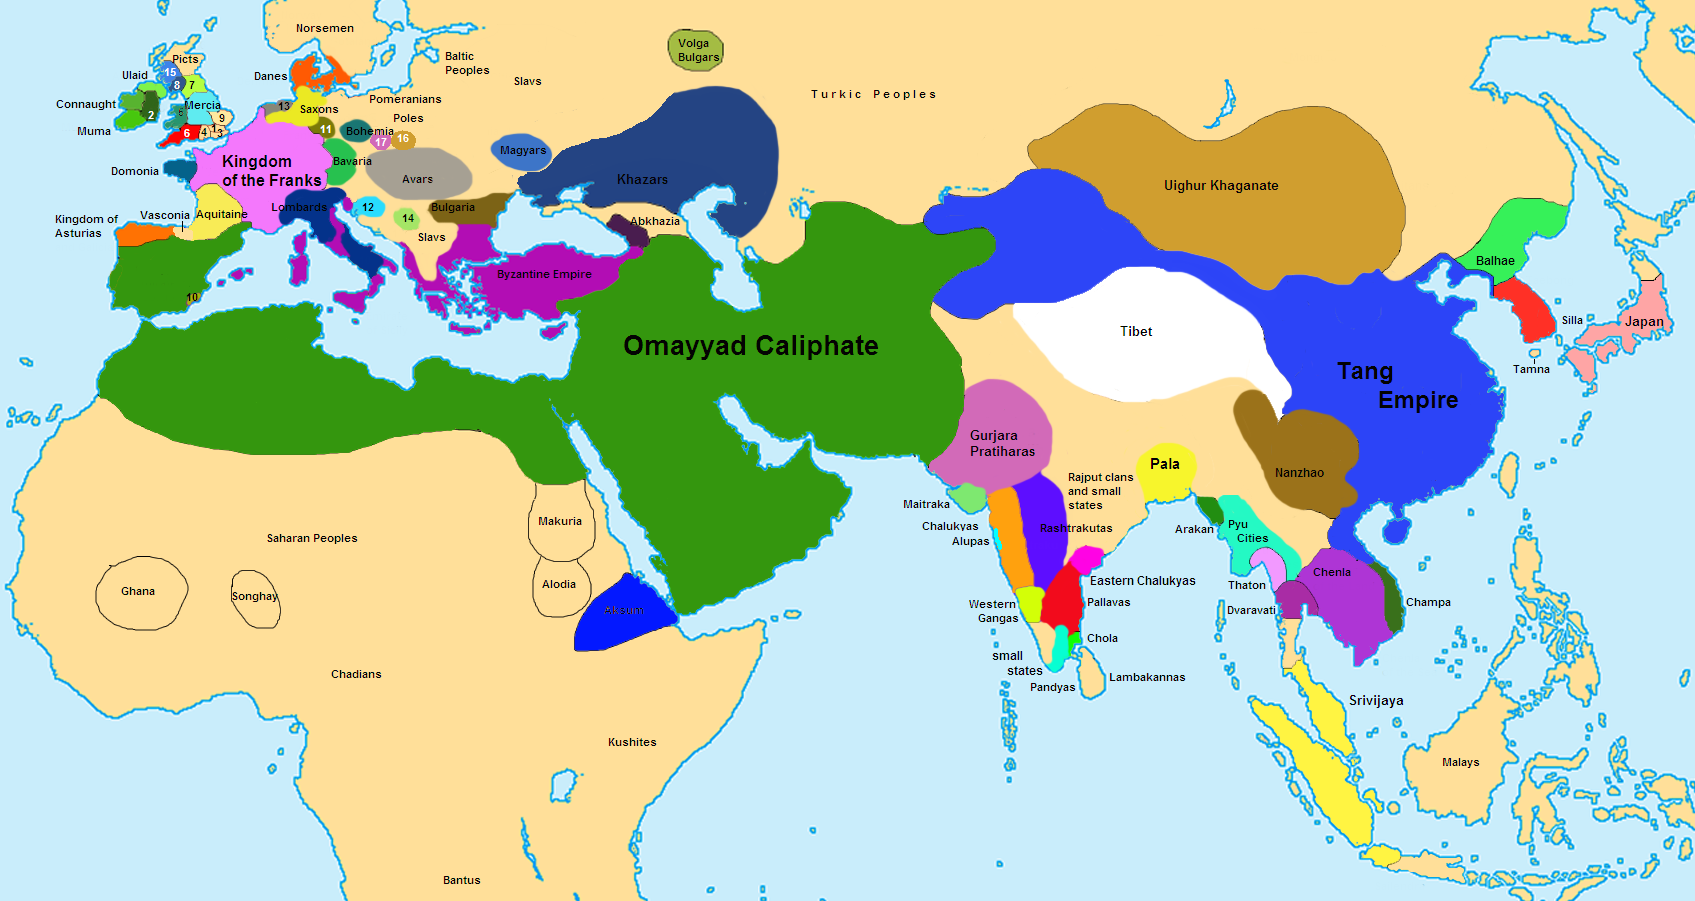
    This is a rough political map of the world in 750 AD, at the height of the Omayyad Caliphate (“caliph” means the ruler of the global Islamic community). This is to give you a sense of how vast and powerful the Muslim empire had become, barely one century after the founding of the religion that propelled its expansion. It was a center of wealth, arts, and learning at a time when only China was so rich and powerful. This was the height of Arab power.

  6. The six-century rise and fall of the Ottoman Empire

    The six-century rise and fall of the Ottoman Empire

    The Ottoman Empire is named for Osman, its first ruler, who in the early 1300s expanded it from a tiny part of northwest Turkey to a slightly less tiny part. It continued expanding for about 500 years — longer than the entire history of the Roman Empire — ruling over most of the Middle East, North Africa, and southeastern Europe for centuries. The empire, officially an Islamic state, spread the religion in southeast Europe but was generally tolerant of other religious groups. It was probably the last great non-European empire until it began declining in the mid-1800s, collapsed after World War I, and had its former territory in the Middle East divided up by Western Europe.

  7. What the Middle East looked like in 1914

    What the Middle East looked like in 1914

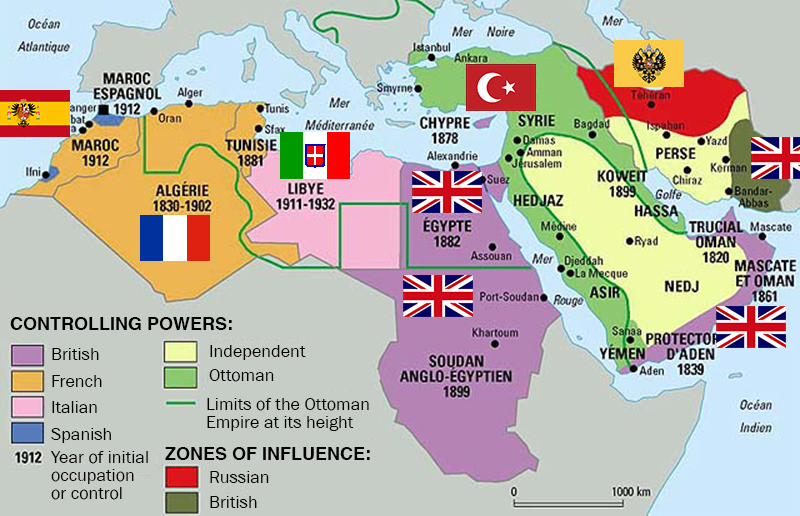
    This is a pivotal year, during the Middle East’s gradual transfer from 500 years of Ottoman rule to 50 to 100 years of European rule. Western Europe was getting richer and more powerful as it carved up Africa, including the Arab states of North Africa, into colonial possessions. Virtually the entire region was ruled outright by Europeans or Ottomans, save some parts of Iran and the Arabian peninsula divided into European “zones of influence.” When World War I ended a few years later, the rest of the defeated Ottoman Empire would be carved up among the Europeans. The lines between French, Italian, Spanish, and British rule are crucial for understanding the region today – not just because they ruled differently and imposed different policies, but because the boundaries between European empires later became the official borders of independence, whether they made sense or not.

  8. The Sykes-Picot treaty that carved up the Middle East

    The Sykes-Picot treaty that carved up the Middle East

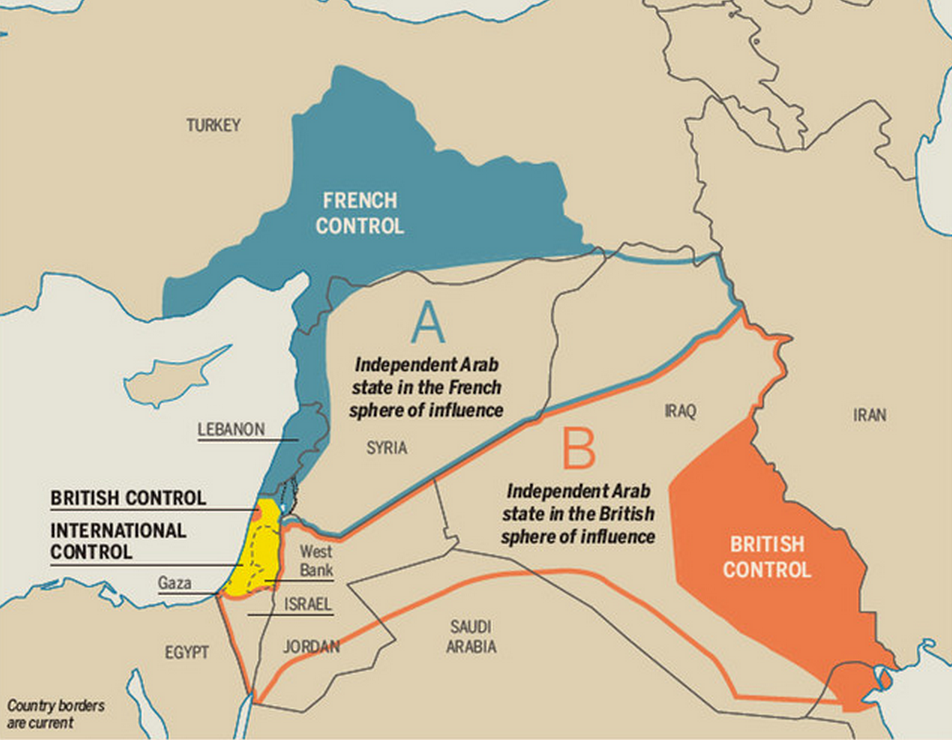
    You hear a lot today about this treaty, in which the UK and French (and Russian) Empires secretly agreed to divide up the Ottoman Empire’s last MidEastern regions among themselves. Crucially, the borders between the French and British “zones” later became the borders between Iraq, Syria, and Jordan. Because those later-independent states had largely arbitrary borders that forced disparate ethnic and religious groups together, and because those groups are still in terrible conflict with one another, Sykes-Picot is often cited as a cause of warfare and violence and extremism in the Middle East. But scholars are still debating this theory, which may be too simple to be true.

  9. An animated history of great empires in the Middle East

    An animated history of great empires in the Middle East

    You may have noticed a theme of the last eight maps: empires, mostly from outside the Middle East but sometimes of it, conquering the region in ways that dramatically changed it. This animation shows you every major empire in the Middle East over the last 5,000 years. To be clear, it is not exhaustive, and in case it wasn’t obvious, the expanding-circle animations do not actually reflect the speed or progression of imperial expansions. But it’s a nice primer.

  10. The complete history of Islamic states

    The complete history of Islamic states

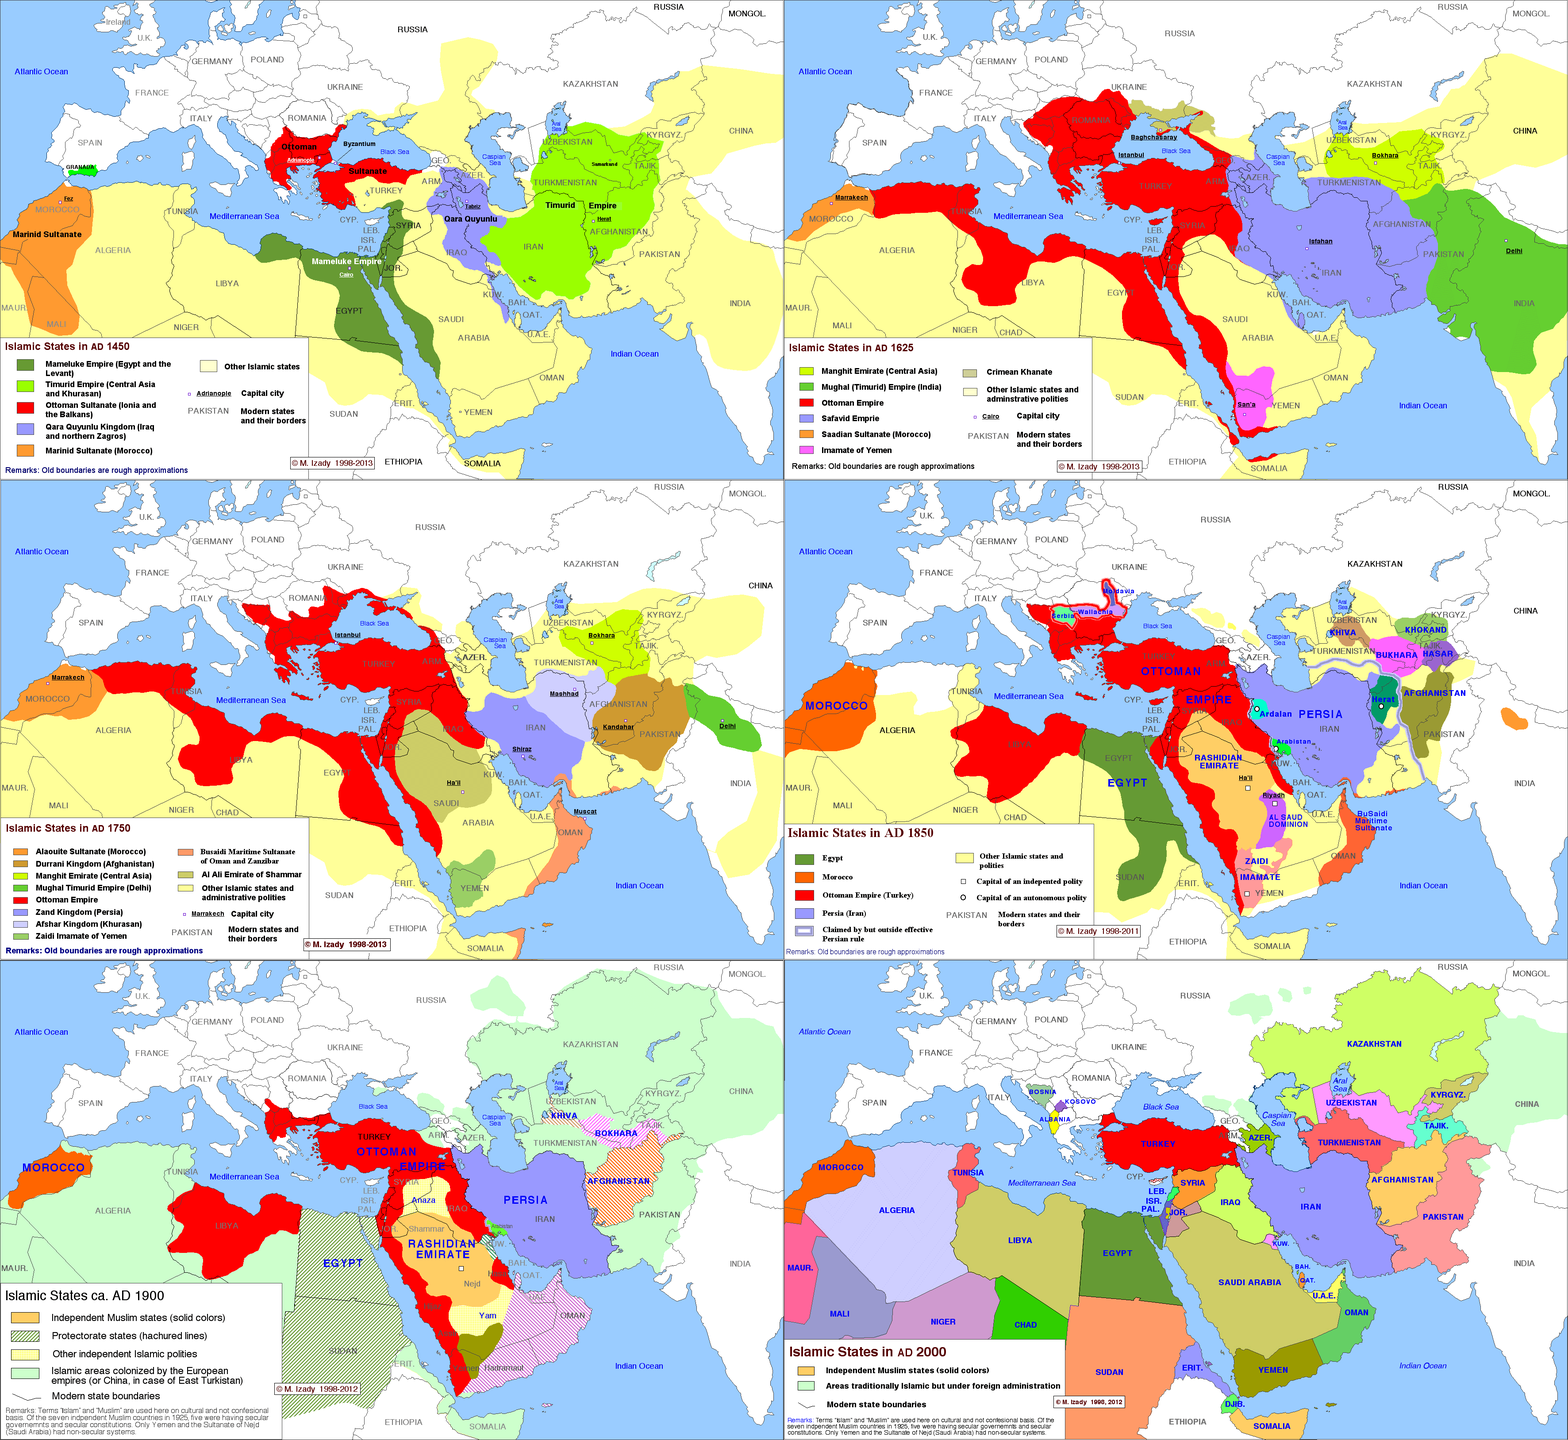
    This time-lapse map by Michael Izady — a wonderful historian and cartographer at Columbia University, whose full collection can be found here — shows the political boundaries of the greater Middle East from 1450 through today. You’ll notice that, for much of the last 500 years, most or all of the region has been under some combination of Turkish, Persian, and European control. For so much of the Arab Middle East to be under self-rule is relatively new. Two big exceptions that you can see on this map are Morocco and Egypt, which have spent more of the last 500 years as self-ruling empires than other Arab states. That’s part of why these two countries have sometimes seen themselves as a degree apart from the rest of the Arab world.

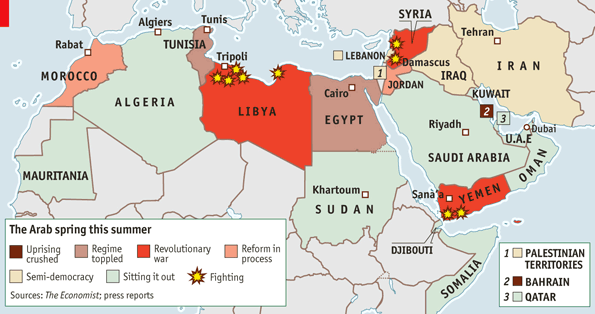
  11. The 2011 Arab Spring

    The 2011 Arab Spring

    It is still amazing, looking back at early and mid-2011, how dramatically and quickly the Arab Spring uprisings challenged and in many cases toppled the brittle old dictatorships of the Middle East. What’s depressing is how little the movements have advanced beyond those first months. Syria’s civil war is still going. Egypt’s fling with democracy appeared to end with a military coup in mid-2013. Yemen is still mired in slow-boil violence and political instability. The war in Libya toppled Moammar Qaddafi, with US and European support, but left the country without basic security or a functioning government. Only Tunisia seems to have come out even tenuously in the direction of democracy.


The Middle East today

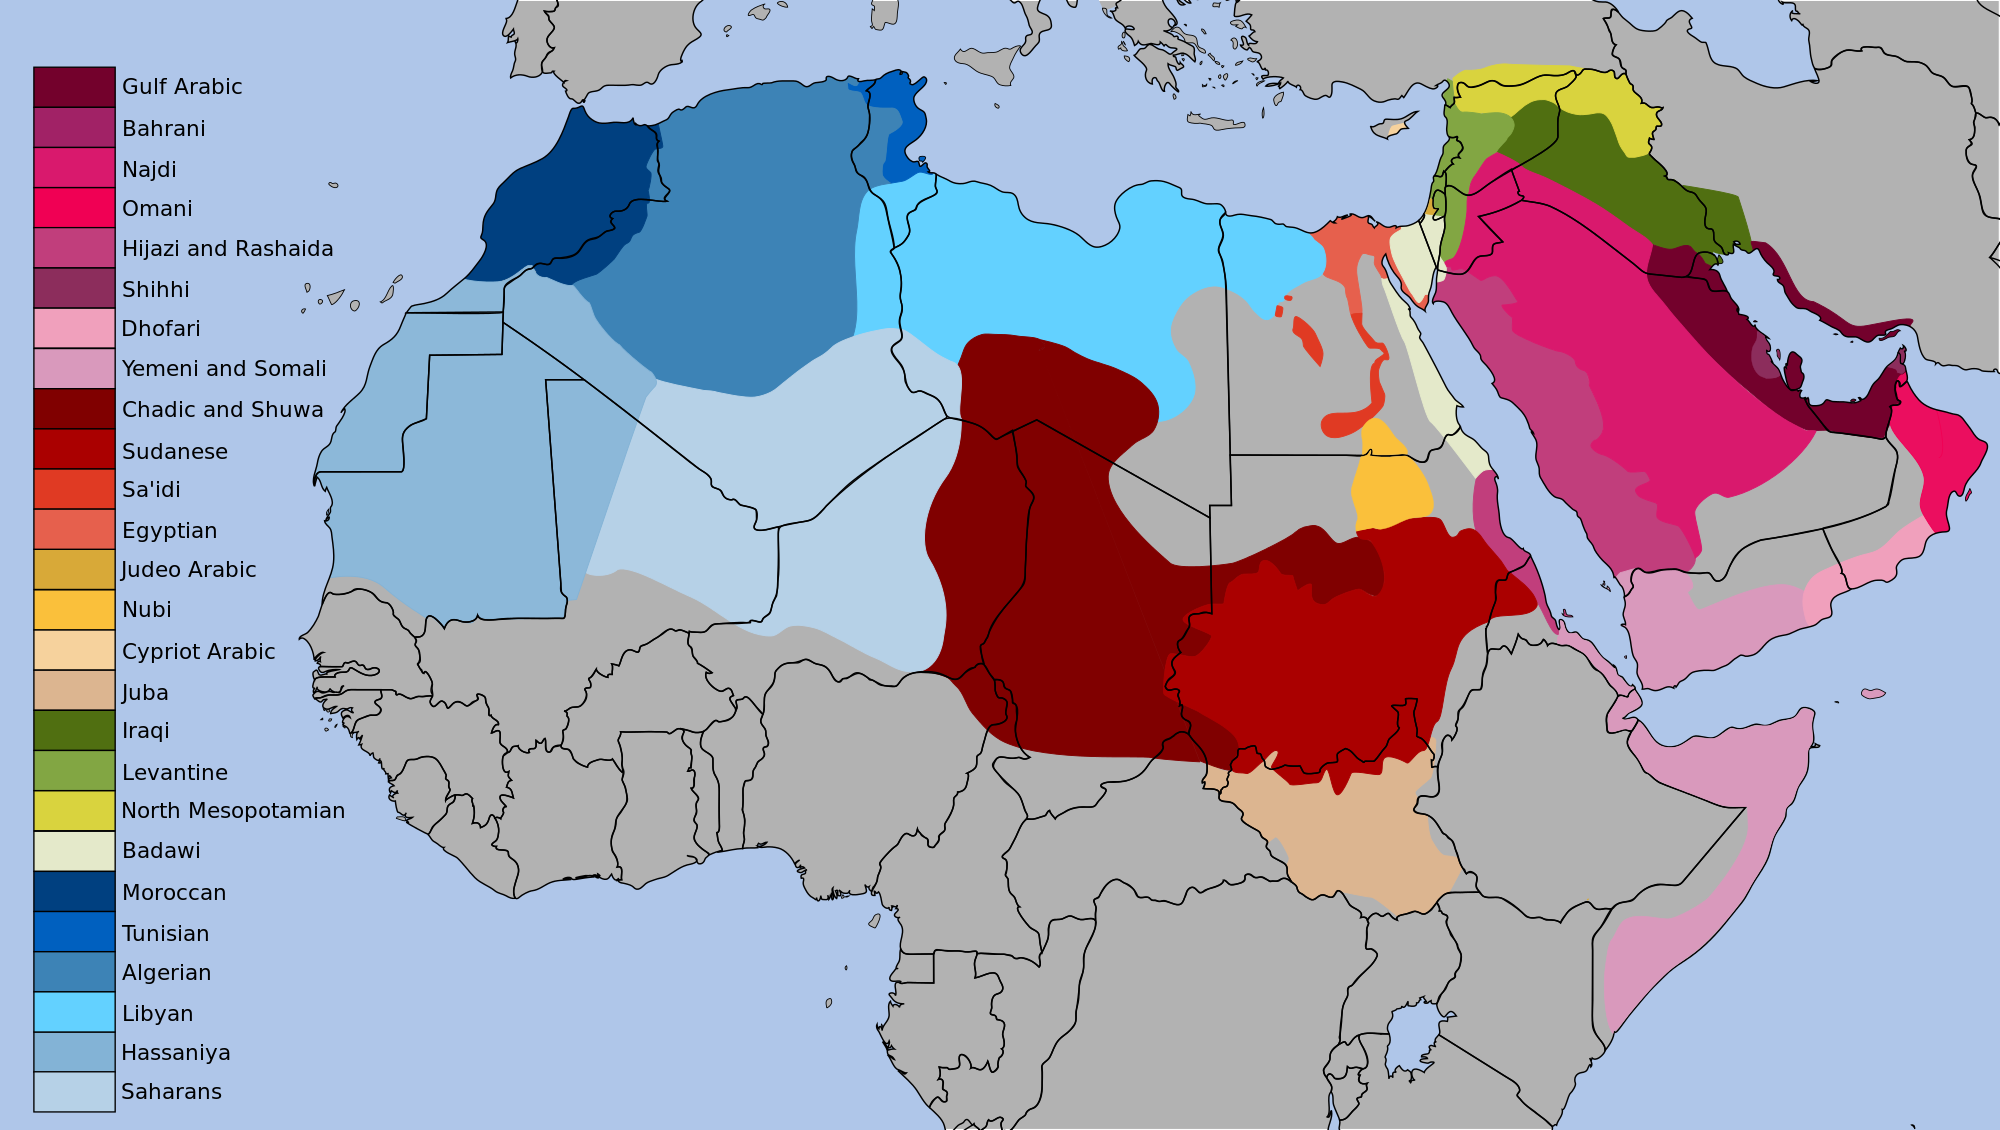
  1. The dialects of Arabic today

    The dialects of Arabic today

    This map shows the vast extent of the Arabic-speaking world and the linguistic diversity within it. Both go back to the Caliphates of the sixth and seventh century, which spread Arabic from its birthplace on the Arabian Peninsula across Africa and the Middle East. Over the last 1,300 years the language’s many speakers have diverged into distinct, sometimes very different, dialects. Something to look at here: where the dialects do and do not line up with present-day political borders. In places where they don’t line up, you’re seeing national borders that are less likely to line up with actual communities, and in some cases more likely to create problems.

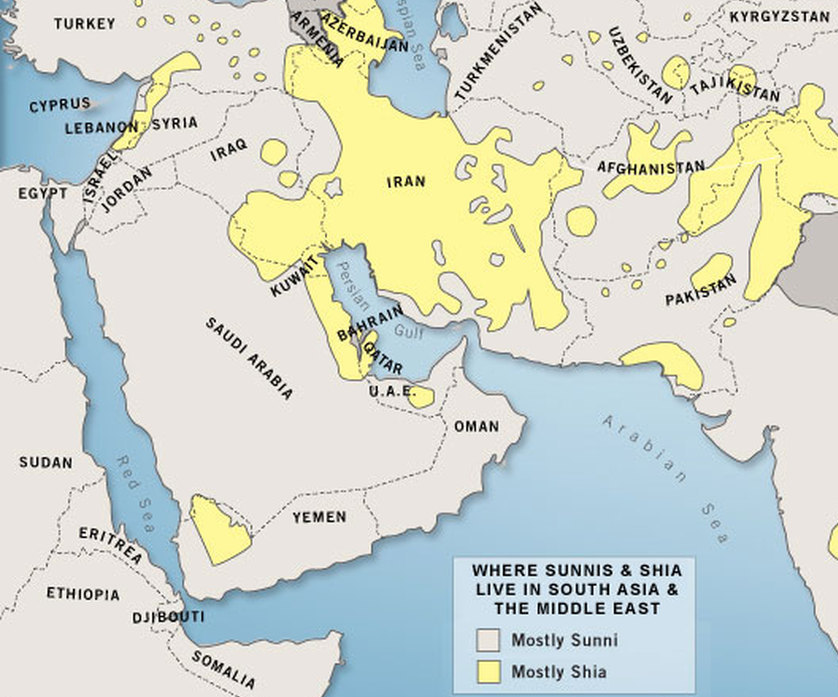
  2. The Sunni-Shia divide

    The Sunni-Shia divide

    The story of Islam’s division between Sunni and Shia started with the Prophet Mohammed’s death in 632. There was a power struggle over who would succeed him in ruling the Islamic Caliphate, with most Muslims wanting to elect the next leader but some arguing that power should go by divine birthright to Mohammed’s son-in-law, Ali. That pro-Ali faction was known as the “Partisans of Ali,” or “Shi’atu Ali” in Arabic, hence “Shia.” Ali’s eventual ascension to the throne sparked a civil war, which he and his partisans lost. The Shia held on to the idea that Ali was the rightful successor, and grew into an entirely separate branch of Islam. Today about 10 to 15 percent of Muslims worldwide are Shia — they are the majority group in Iran and Iraq only — while most Muslims are Sunni. “Sunni” roughly means “tradition.” Today, that religious division is again a political one as well: it’s a struggle for regional influence between Shia political powers, led by Iran, versus Sunni political powers, led by Saudi Arabia. This struggle looks an awful lot like a regional cold war, with proxy battles in Syria and elsewhere.

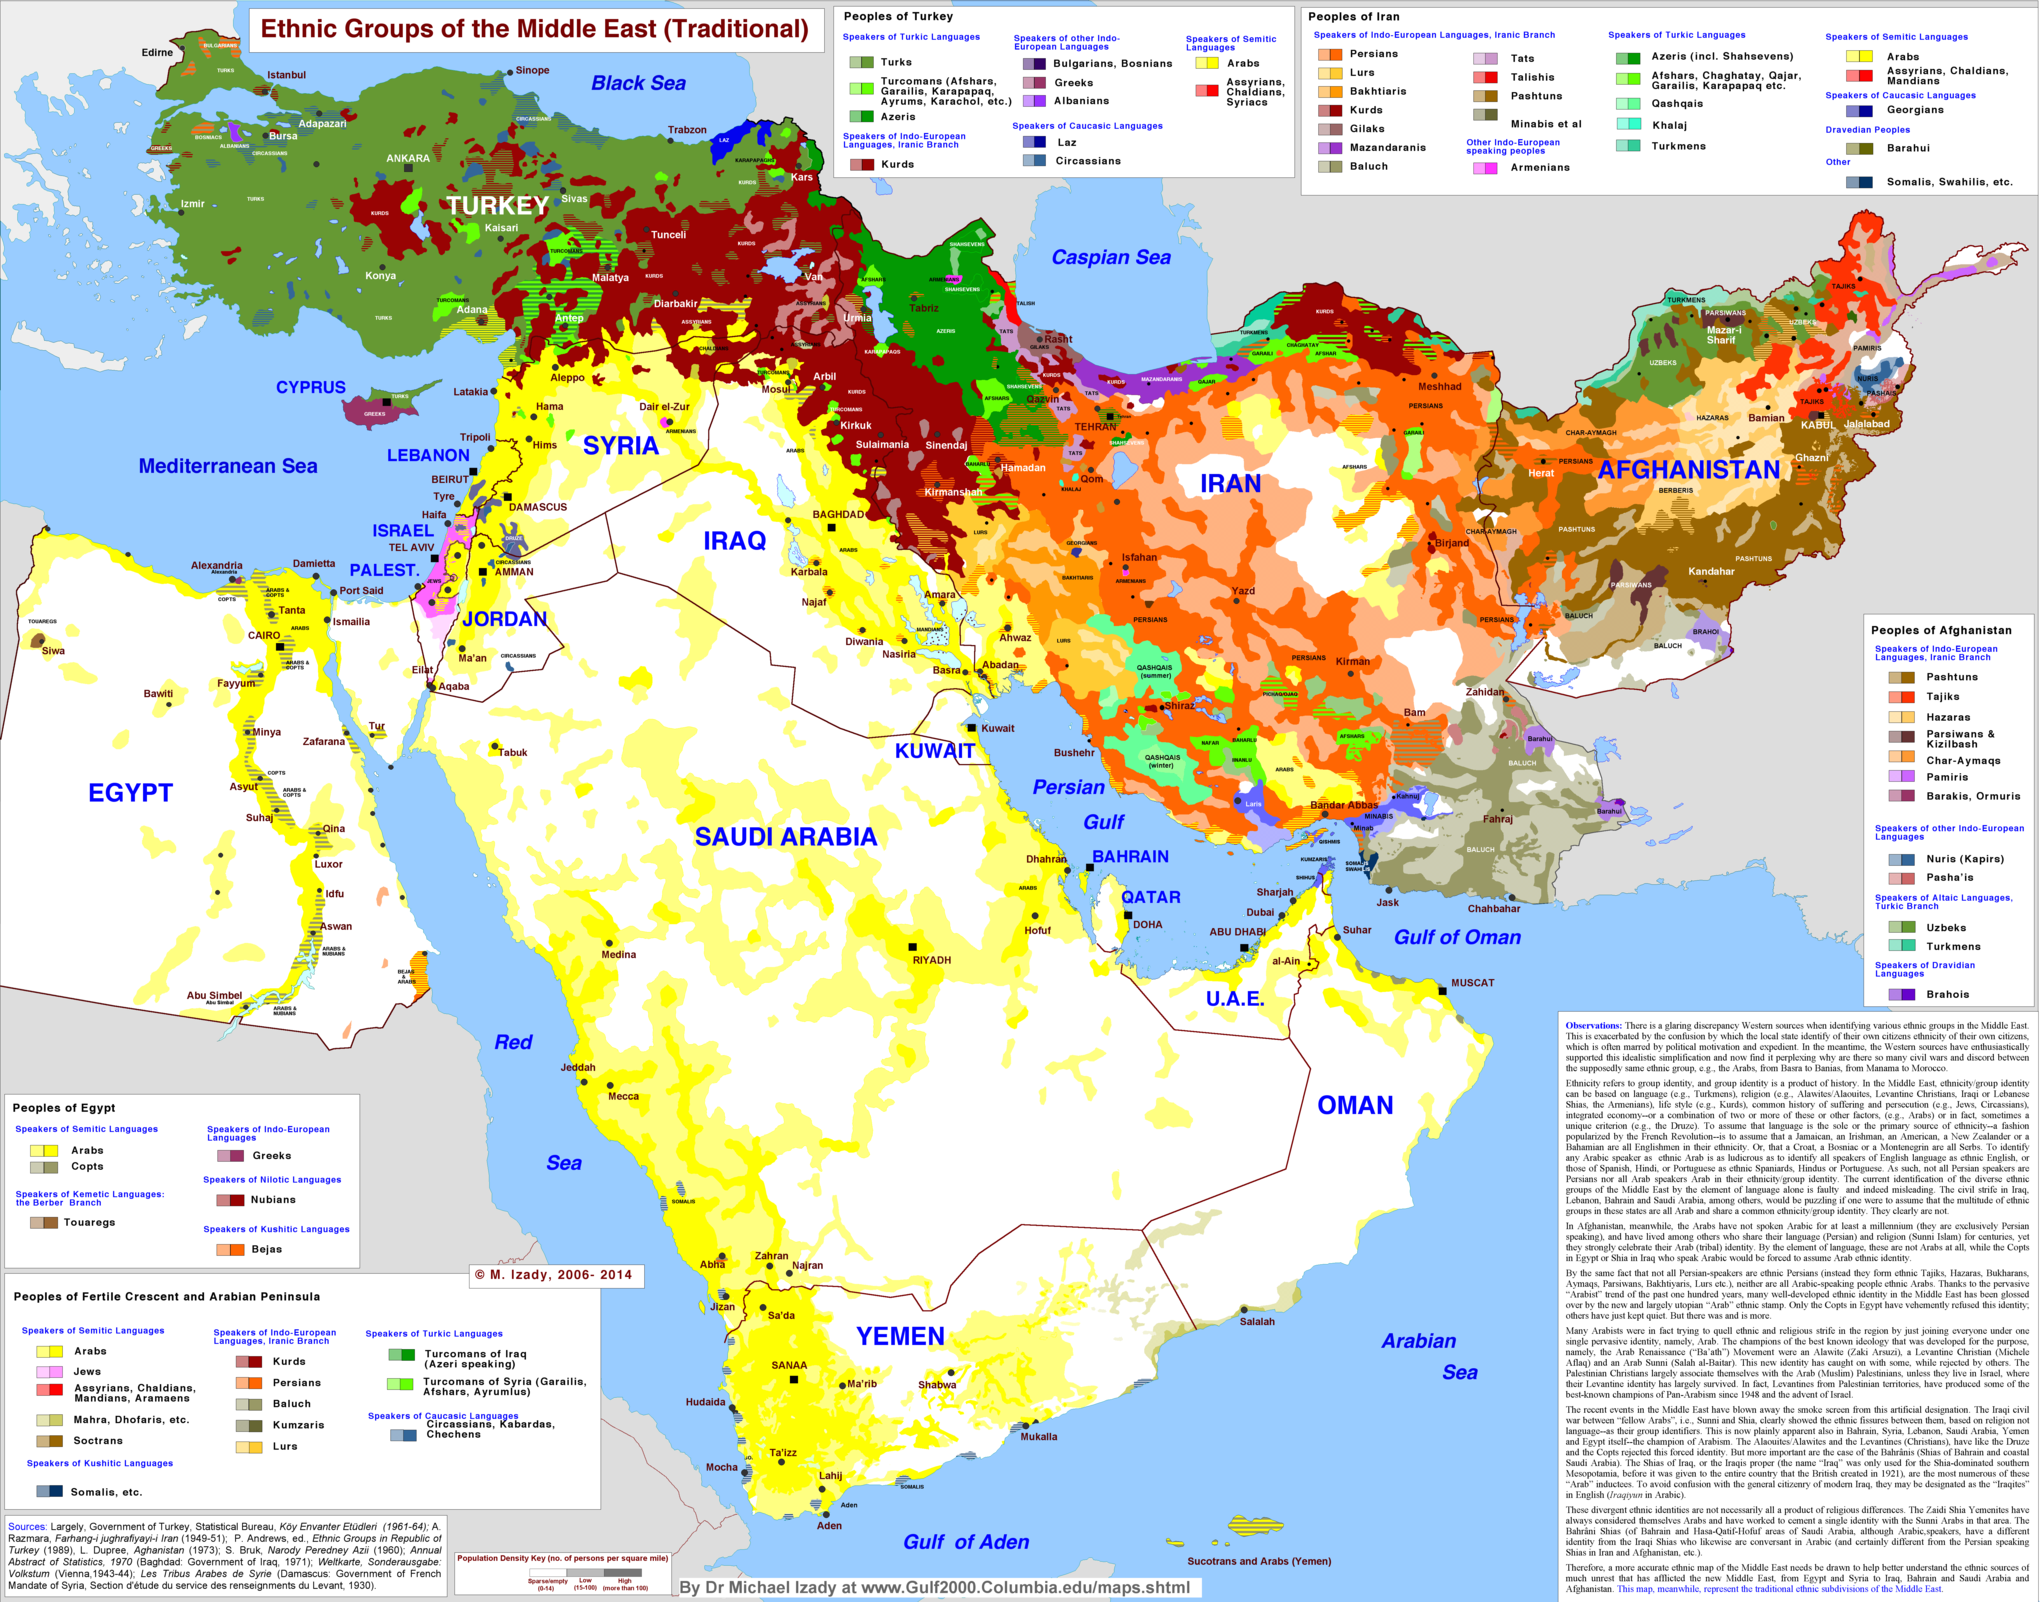
  3. The ethnic groups of the Middle East

    The ethnic groups of the Middle East

    The most important color on this map of Middle Eastern ethnic groups is yellow: Arabs, who are the majority group in almost every MidEast country, including the North African countries not shown here. The exceptions are mostly-Jewish Israel in pink, mostly-Turkish Turkey in green, mostly-Persian Iran in orange, and heavily diverse Afghanistan. (More on the rich diversity of Iran and Afghanistan below.) That splash of red in the middle is really important: ethnic Kurds, who have no country of their own but big communities in Iran, Iraq, Syria, and Turkey. But the big lesson of this map is that there is a belt of remarkable ethnic diversity from Turkey to Afghanistan, but that much of the rest of the region is dominated by ethnic Arabs.

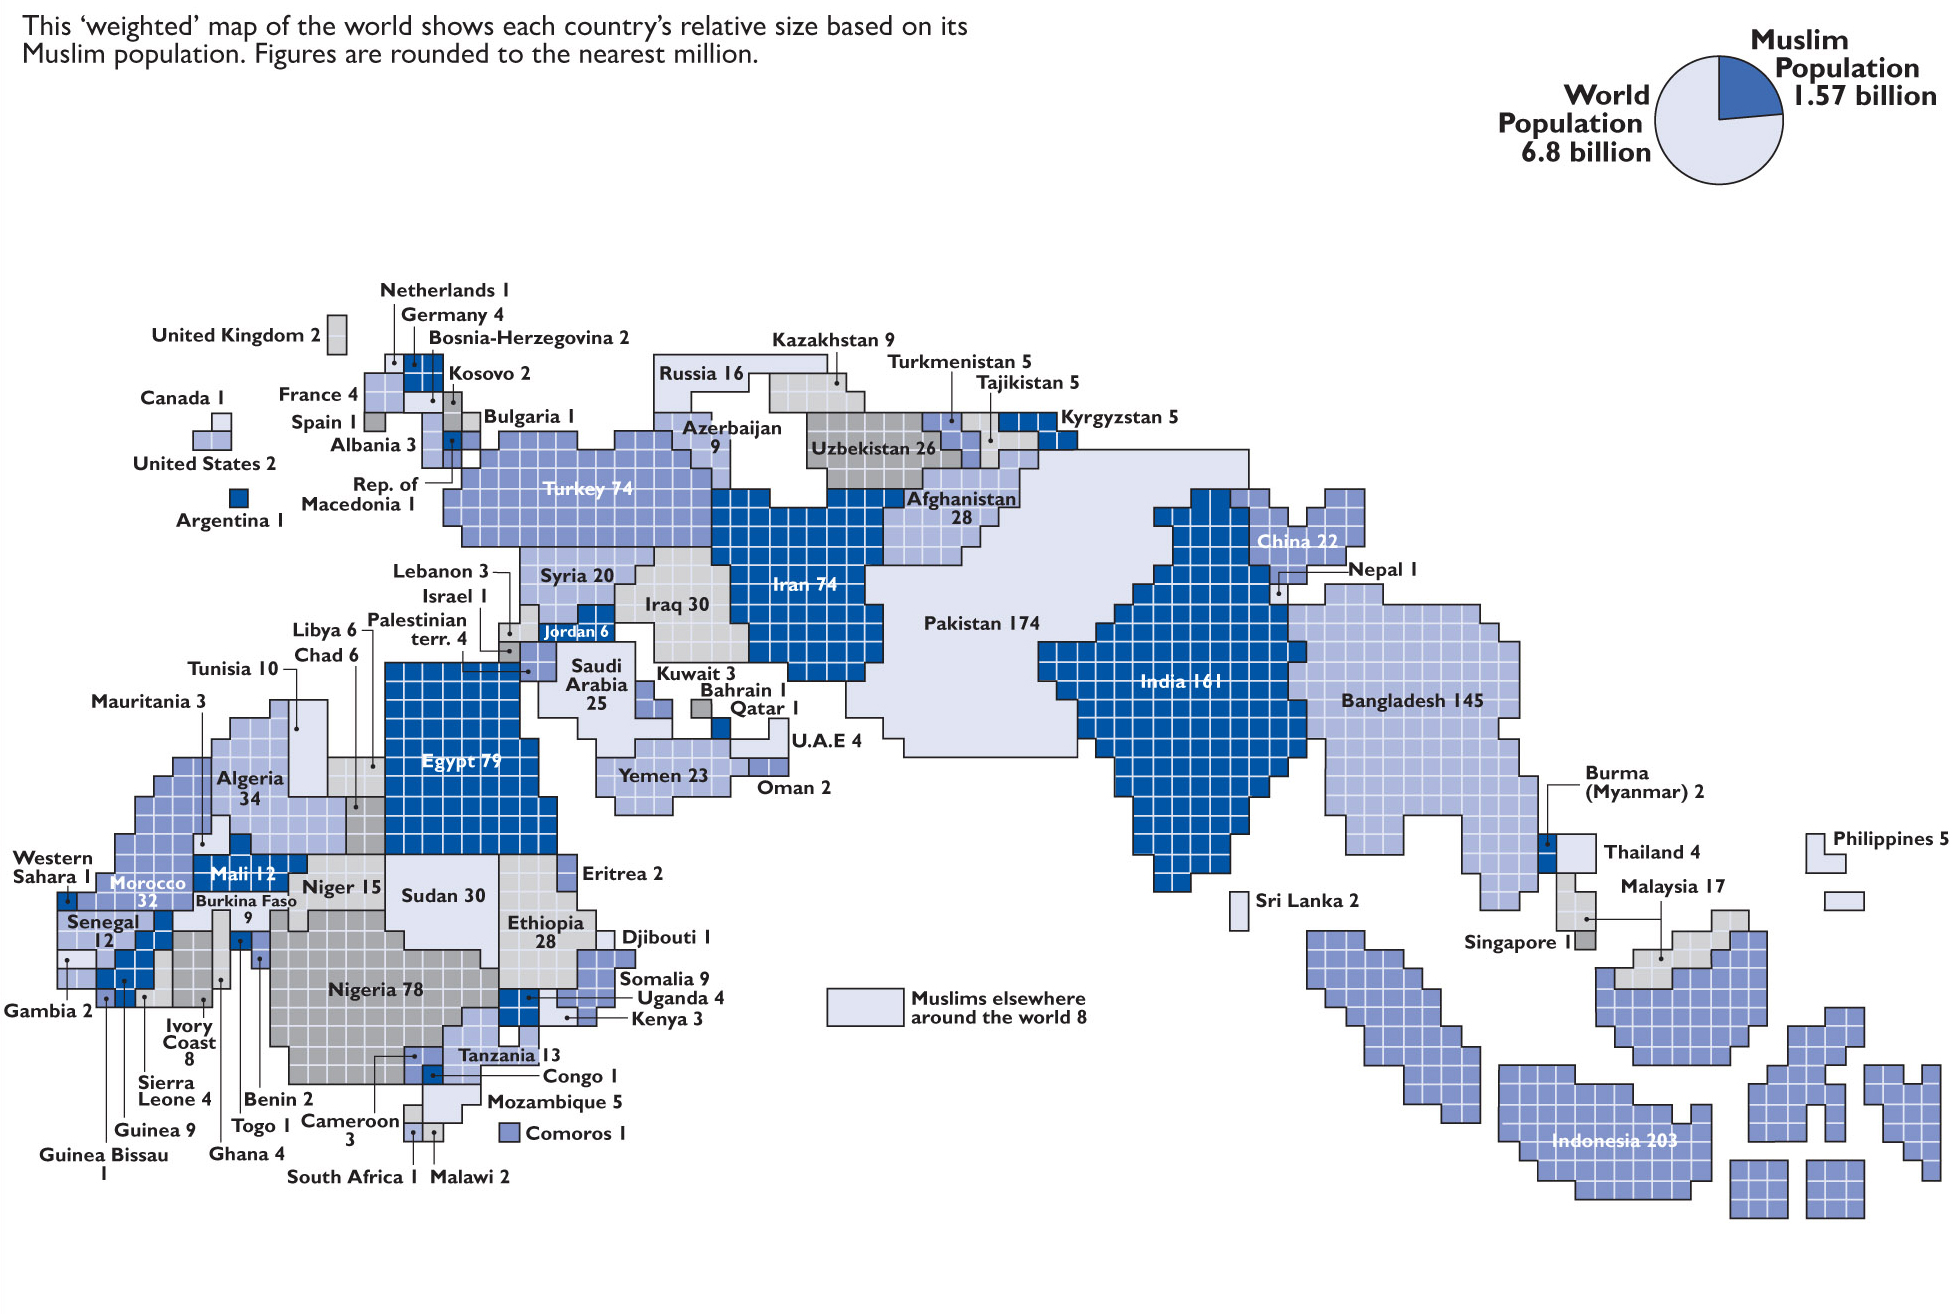
  4. Weighted Muslim populations around the world

    Weighted Muslim populations around the world

    This map makes a point about what the Middle East is not: it is not synonymous with the Islamic world. This weighted population map shows every country in the world by the size of its Muslim population. Countries with more Muslim citizens are larger; countries with fewer Muslim citizens are smaller. You’ll notice right away that the Middle East makes up just a fraction of the world’s total Muslim population. There are far more Muslims, in fact, in the South Asian countries of India, Pakistan, and Bangladesh. The biggest Muslim population by far is Indonesia’s, in southeast Asia. And there are millions in sub-Saharan Africa as well. The Islamic world may have begun in the Middle East, but it’s now much, much larger than that.


Israel-Palestine

  1. Israel’s 1947 founding and the 1948 Israeli-Arab War

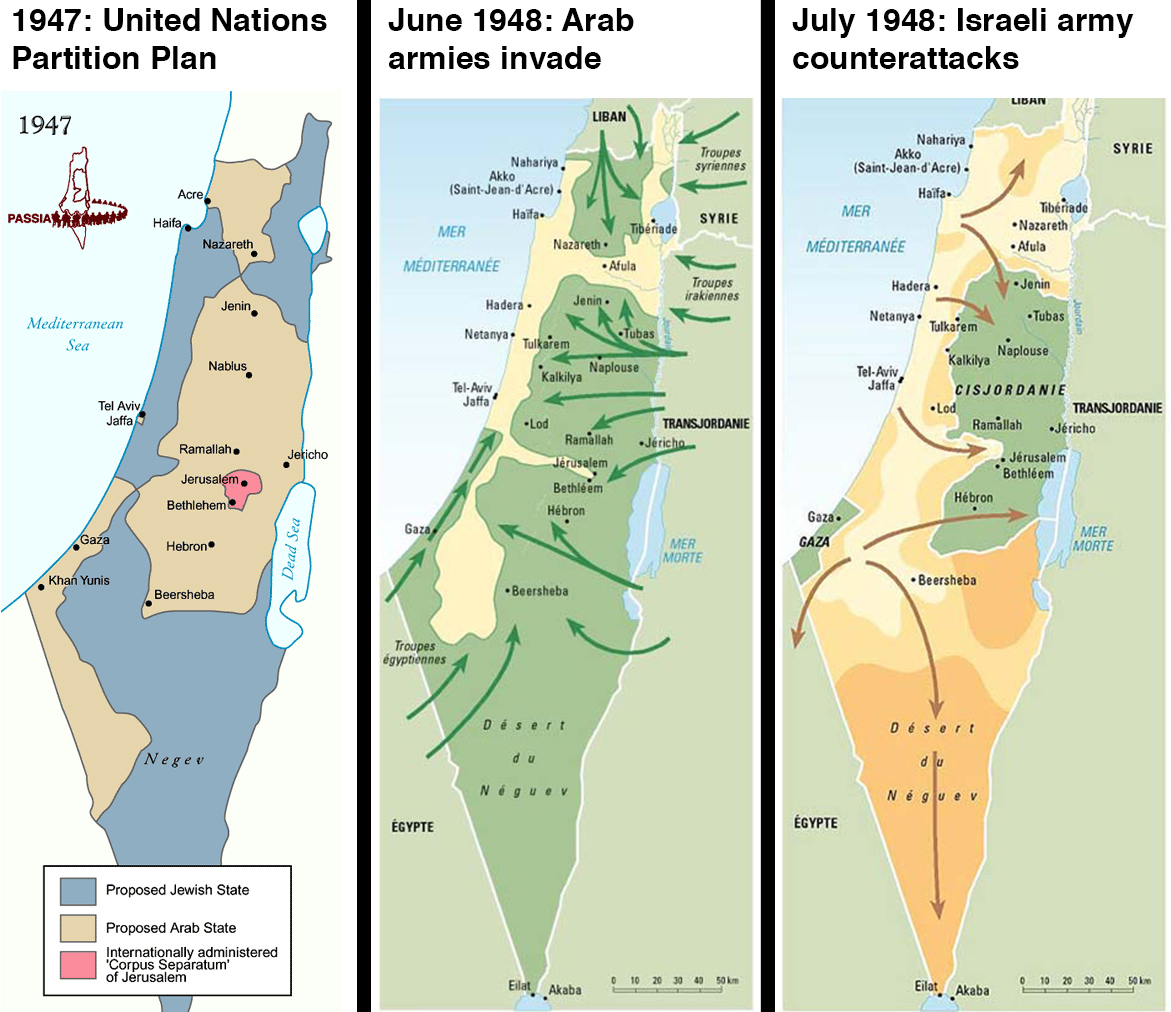
    Israel's 1947 founding and the 1948 Israeli-Arab War

    Left map: Passia; center and right maps: Philippe Rekacewicz / Le Monde Diplomatique

    Israel’s 1947 founding and the 1948 Israeli-Arab War

    These three maps show how Israel went from not existing to, in 1947 and 1948, establishing its national borders. It’s hard to identify a single clearest start point to the Israel-Palestine conflict, but the map on the left might be it: these are the borders that the United Nations demarcated in 1947 for a Jewish state and an Arab state, in what had been British-controlled territory. The Palestinians fought the deal, and in 1948 the Arab states of Egypt, Jordan, Iraq, and Syria invaded. The middle map shows, in green, how far they pushed back the Jewish armies. The right-hand map shows how the war ended: with an Israeli counterattack that pushed into the orange territory, and with Israel claiming that as its new national borders. The green is what was left for Palestinians.

  2. The 1967 Israeli-Arab War that set today’s borders

    The 1967 Israeli-Arab War that set today's borders

    BBC

    The 1967 Israeli-Arab War that set today’s borders

    These three maps (click the expand icon to see the third) show how those 1948 borders became what they are today. The map on left shows the Palestinian territories of Gaza, which was under Egyptian control, and the West Bank, under Jordanian control. In 1967, Israel fought a war with Egypt, Jordan, and Syria. The war ended with Israel occupying both of the Palestinian territories, plus the Golan Heights in Syria and Egypt’s Sinai peninsula: that’s shown in the right map. Israel gave Sinai back as part of a 1979 peace deal, but it still occupies those other territories. Gaza is today under Israeli blockade, while the West Bank is increasingly filling with Israeli settlers. The third map shows how the West Bank has been divided into areas of full Palestinian control (green), joint Israeli-Palestinian control (light green), and full Israeli control (dark green).

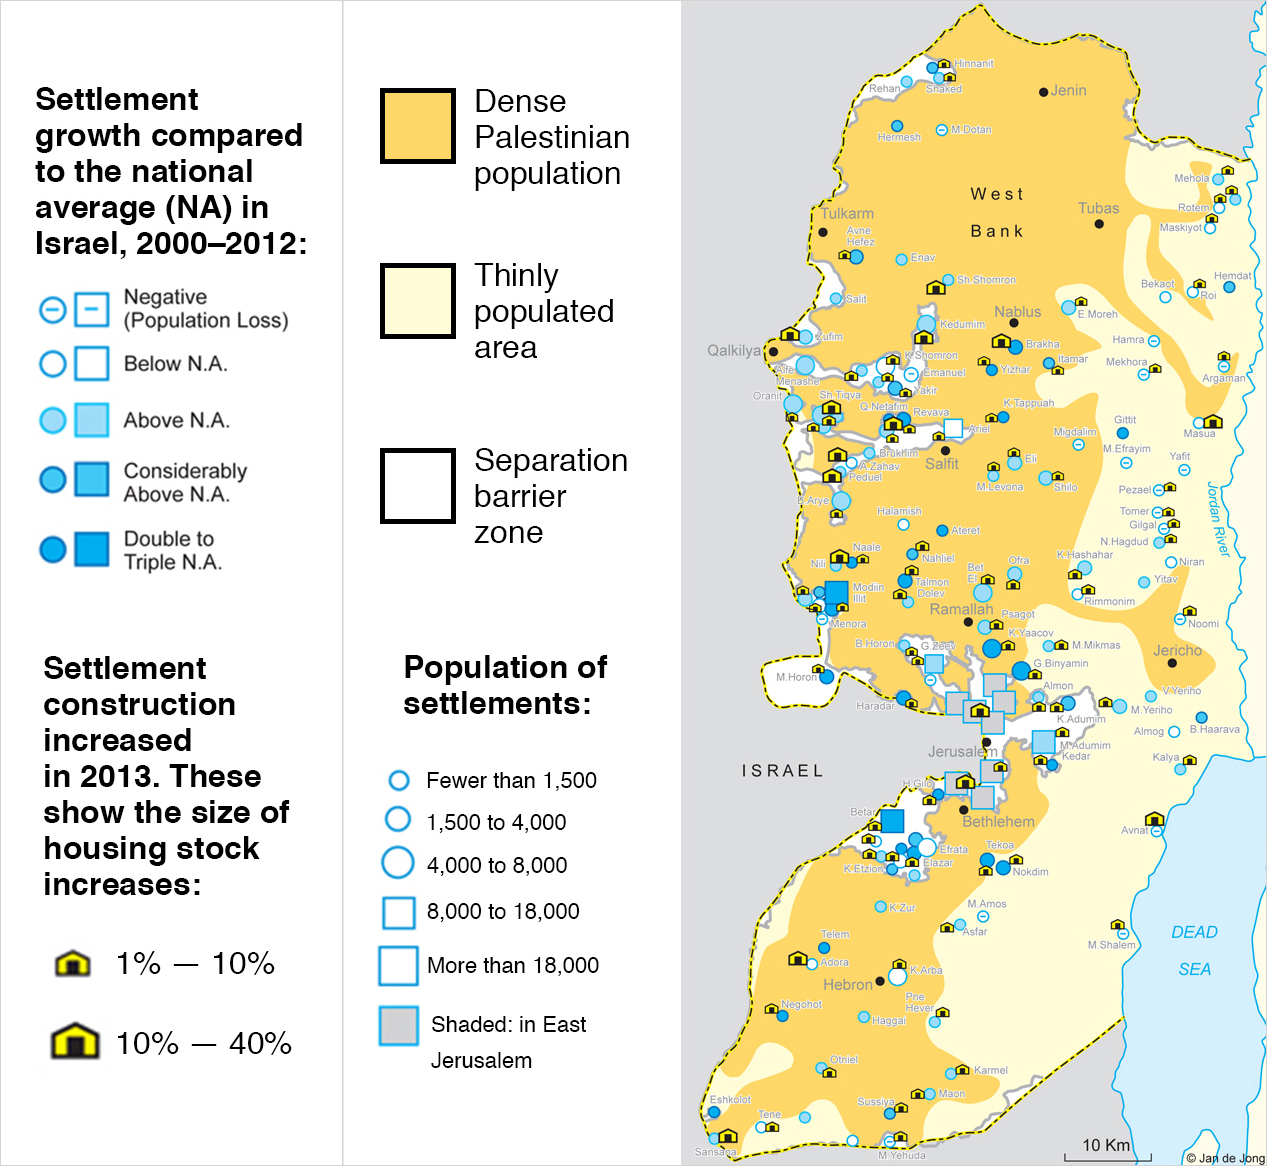
  3. Israeli settlements in the Palestinian West Bank

    Israeli settlements in the Palestinian West Bank

    Since 1967, Israelis have been moving into settlements in the West Bank. Some go for religious reasons, some because they want to claim Palestinian land for Israel, and some just because they get cheap housing from subsidies. There about 500,000 settlers in 130 communities, which you can see in this map. The settlements make peace harder, which is sometimes the point: for Palestinians to have a state, the settlers will either to have to be removed en masse, or Palestinians would have to give up some of their land. The settlements also make life harder for Palestinians today, dividing communities and imposing onerous Israeli security. This is why the US and the rest of the world opposes Israeli settlements. But Israel is continuing to expand them anyway.

  4. Israeli and Hezbollah strikes in the 2006 Lebanon War

    Israeli and Hezbollah strikes in the 2006 Lebanon War

    BBC

    Israeli and Hezbollah strikes in the 2006 Lebanon War

    This map shows a moment in the 2006 war between Israel and Lebanon. It also shows the way that war between Israel and its enemies has changed: Israel now has the dominant military, but the fights are asymmetrical. Israel wasn’t fighting a state, but the Lebanese militant group Hezbollah. It launched many air and artillery strikes in Lebanon (shown in blue) to weaken Hezbollah, destroying much of the country’s infrastructure in the process. Israel also blockaded Lebanese waters. Hezbollah fought a guerrilla campaign against the Israeli invasion force and launched many missiles into Israeli communities. The people most hurt were regular Lebanese and Israelis, hundreds of thousands of whom were displaced by the fighting.

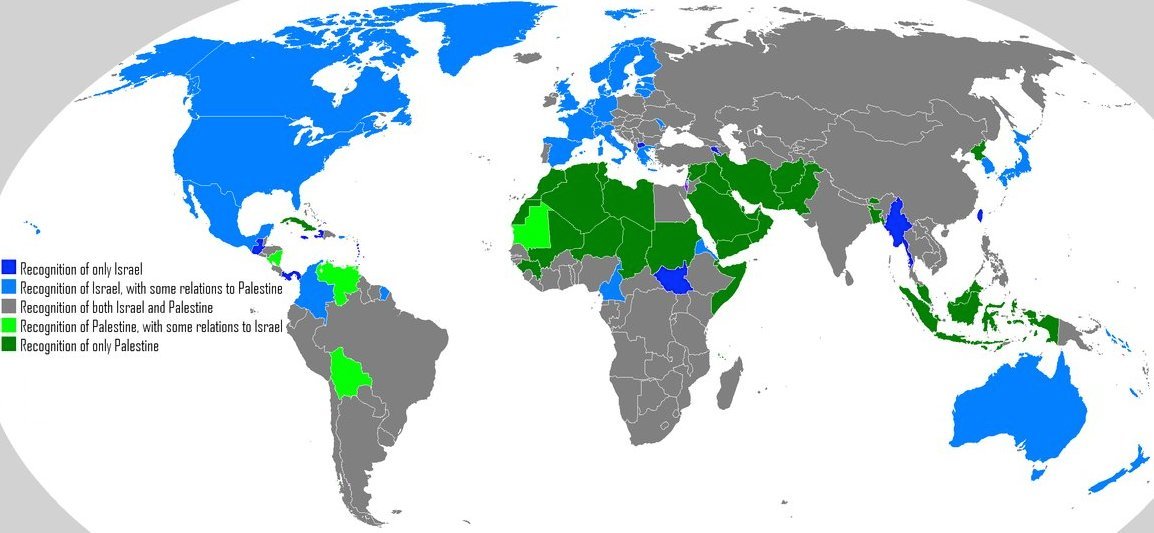
  5. Which countries recognize Israel, Palestine, or both

    Which countries recognize Israel, Palestine, or both

    The Israel-Palestine conflict is a global issue, and as this map shows it’s got a global divide. Many countries, shown in green, still do not recognize Israel as a legitimate state. Those countries are typically Muslim-majority (that includes Malaysia and Indonesia, way over in southeast Asia). Meanwhile, the blue countries of the West (plus a few others) do not recognize Palestine as a country. They still have diplomatic relations with Palestine, but in their view it will not achieve the status of a country until the conflict is formally resolved. It is not a coincidence that there has historically been some conflict between the blue and green countries.


Syria

  1. Syria’s religious and ethnic diversity

    Syria’s religious and ethnic diversity

    Each color here shows a different religious group in the part of the eastern Mediterranean called the Levant. It should probably not be surprising that the birthplace of Judaism and Christianity is religiously diverse, but this map drives home just how diverse. Israel stands out for its Jewish majority, of course, but this is also a reminder of its Muslim and other minorities, as well as of the Christian communities in Israel and the West Bank. Lebanon is divided among large communities of Sunnis, Shias, Christians, and a faith known as Druze — they’re at peace now, but the country’s horrific civil war from 1975 to 1990 divided them. There may be a similar effect happening in Syria, which is majority Sunni Muslim but has large minorities of Christians, Druze, Shia, and a Shia sect known as Alawites whose members include Syrian leader Bashar al-Assad and much of his government.

  2. Current areas of control in the Syrian Civil War

    Current areas of control in the Syrian Civil War

    This map shows the state of play in Syria’s civil war, which after three years of fighting has divided between government forces, the anti-government rebels who began as pro-democracy protestors, and the Islamist extremist fighters who have been moving in over the last two years. You may notice some overlap between this map and the previous: the areas under government control (in red) tend to overlap with where the minorities live. The minorities tend to be linked to the regime, whereas the rebels are mostly from the Sunni Muslim majority. But the anti-government Syrian rebels (in green) have been taking lots of territory. Syria’s ethnic Kurdish minority also has militias that have taken over territory where the Kurds live. Over the past year, though, there’s been a fourth rising faction: Islamic State of Iraq and the Levant (sometimes called ISIS, shown in blue), an extremist group based in Iraq that swears allegiance to al-Qaeda. They’re fighting both the rebels and the government. So it’s a three-way war now, as if it weren’t already intractable enough.

  3. Syria’s refugee crisis

    Syria’s refugee crisis

    Syria’s civil war hasn’t just been a national catastrophe for Syria, but for neighboring countries as well. The war has displaced millions of Syrians into the rest of the Middle East and into parts of Europe, where they live in vast refugee camps that are major drains on already-scarce national resources. This map shows the refugees; it does not show the additional 6.5 million Syrians displaced within Syria. Their impact is especially felt in Jordan and Lebanon, which already have large Palestinian refugee populations; as many as one in five people in those countries is a refugee. While the US and other countries have committed some aid for refugees, the United Nations says it’s not nearly enough to provide them with basic essentials.


Iran

  1. How Iran’s borders changed in the early 1900s

    How Iran’s borders changed in the early 1900s

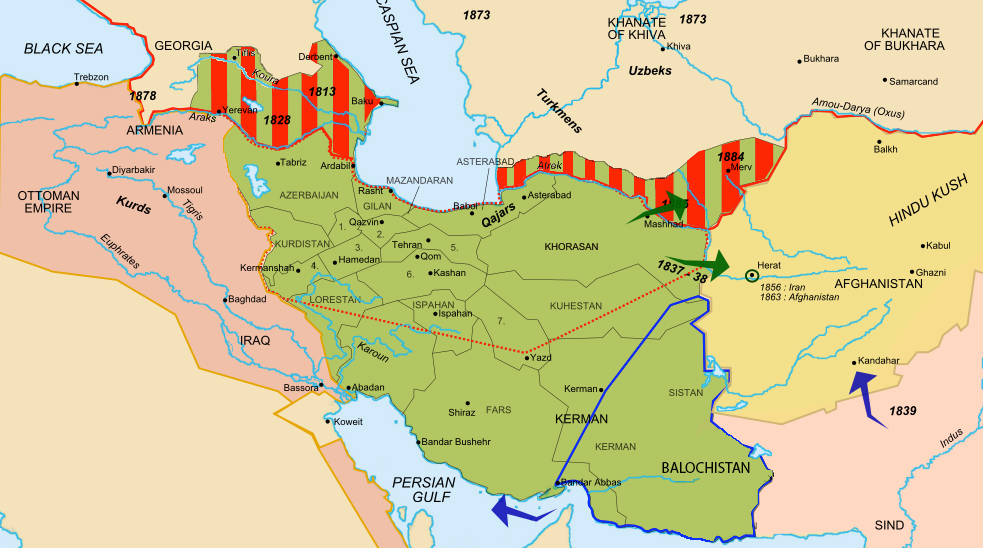
    Iran is the only Middle Eastern country was never conquered by a European power, but it came pretty close in the 1900s. It lost a lot of territory to Russia (the red stripey part). After that, the Russian Empire and British Empire (the British Indian Raj was just next door) divided Iran’s north and south into “zones of influence.” They weren’t under direct control, but the Iranian government was bullied and its economy and resources exploited. This remains a point of major national resentment in Iran today.

  2. Iran’s religious and ethnic diversity

    Iran’s religious and ethnic diversity

    Iran is most associated with the Persians — the largest ethnic group and the progenitors of the ancient Persian empires — but it’s much more diverse than that. This map shows the larger minorities, which includes Arabs in the south, Kurds in the west, and Azeris in the north (Iran used to control all Azeri territory, but much of now belongs to the Azeri-majority country Azerbaijan). The Baloch, in the southeast, are also a large minority group in Pakistan. There is significant unrest and government oppression in the “Baluchistan” region of both countries.

  3. Iran’s nuclear sites and possible Israeli strike plans

    Iran's nuclear sites and possible Israeli strike plans

    BBC

    Iran’s nuclear sites and possible Israeli strike plans

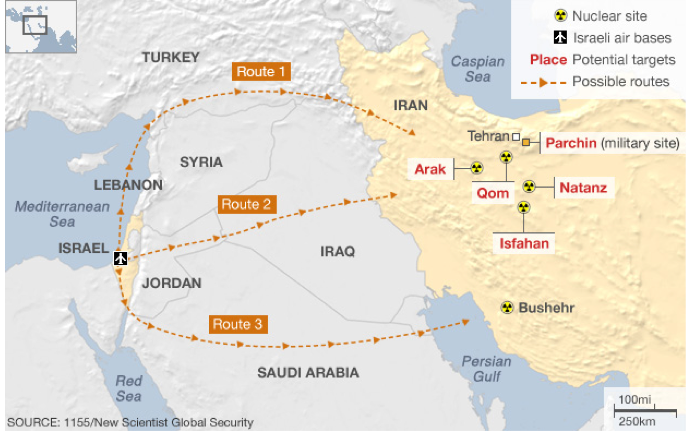
    This is a glimpse at two of the big, overlapping geopolitical issues in which Iran is currently embroiled. The first is Iran’s nuclear program: the country’s leaders say the program is peaceful, but basically no one believes them, and the world is heavily sanctioning Iran’s economy to try to convince them to halt the nuclear development that sure looks like it’s heading for an illegal weapons program. You can see the nuclear development sites on here: some are deep underground, while others were kept secret for years. That gets to the other thing on this map, which was originally built to show how Israel could hypothetically launch strikes against Iran’s nuclear program. Israel-Iran tensions, which have edged near war in recent years, are one of the biggest and most potentially dangerous things happening right now in a part of the world that has plenty of danger already. Israel is worried that Iran could build nukes to use against it; Iran may be worried that it will forever be under threat of Israeli strike until it has a nuclear deterrent. That’s called a security dilemma and it can get bad.


Afghanistan

  1. How the colonial “Durand Line” set up Afghanistan’s conflict

    How the colonial “Durand Line” set up Afghanistan’s conflict

    So, first ignore everything on this map except for the light-orange overlay. That shows the area where an ethnic group called the Pashtun lives. Now pretend it’s the 1800s and you are a British colonial officer named Mortimer Durand, and it’s your job to negotiate the border between the British Indian Raj and the quasi-independent nation of Afghanistan. Do you draw the border right smack across the middle of the Pashtun areas, thus guaranteeing decades of conflict by forcing Pashtuns to be minorities in both states? If you answered “yes,” then you would have made a great British colonial officer, because that’s what happened. The “Durand Line,” marked in red, became most of the border between modern Afghanistan and Pakistan. Many Pashtun now belong to or support a mostly-Pashtun extremist group called the Taliban, which wreaks havoc in both countries and has major operating bases (shown in dark orange) in the Pakistani side of the border. Thanks, Mortimer!

  2. The 1989 war that tore up Afghanistan

    The 1989 war that tore up Afghanistan

    In 1979, the Soviet Union invaded Afghanistan to defend the pro-Moscow communist government from growing rebellions. The US (along with Saudi Arabia and Pakistan) funded and armed the rebels. The CIA deliberately chose to fund extremists, seeing them as better fighters. When the Soviets retreated in 1989, those rebel groups turned against one another, fighting a horrific civil war that you can see on this map: the red areas were, as of 1989, under government control. Every other color shows a rebel group’s area of control. Some of these rebels, like the Hezb-i Islami Gulbuddin, are still fighting, though most of them were defeated when the Taliban rose up and conquered the country in the 1990s.

  3. How the Taliban overlaps with ethnicity

    How the Taliban overlaps with ethnicity

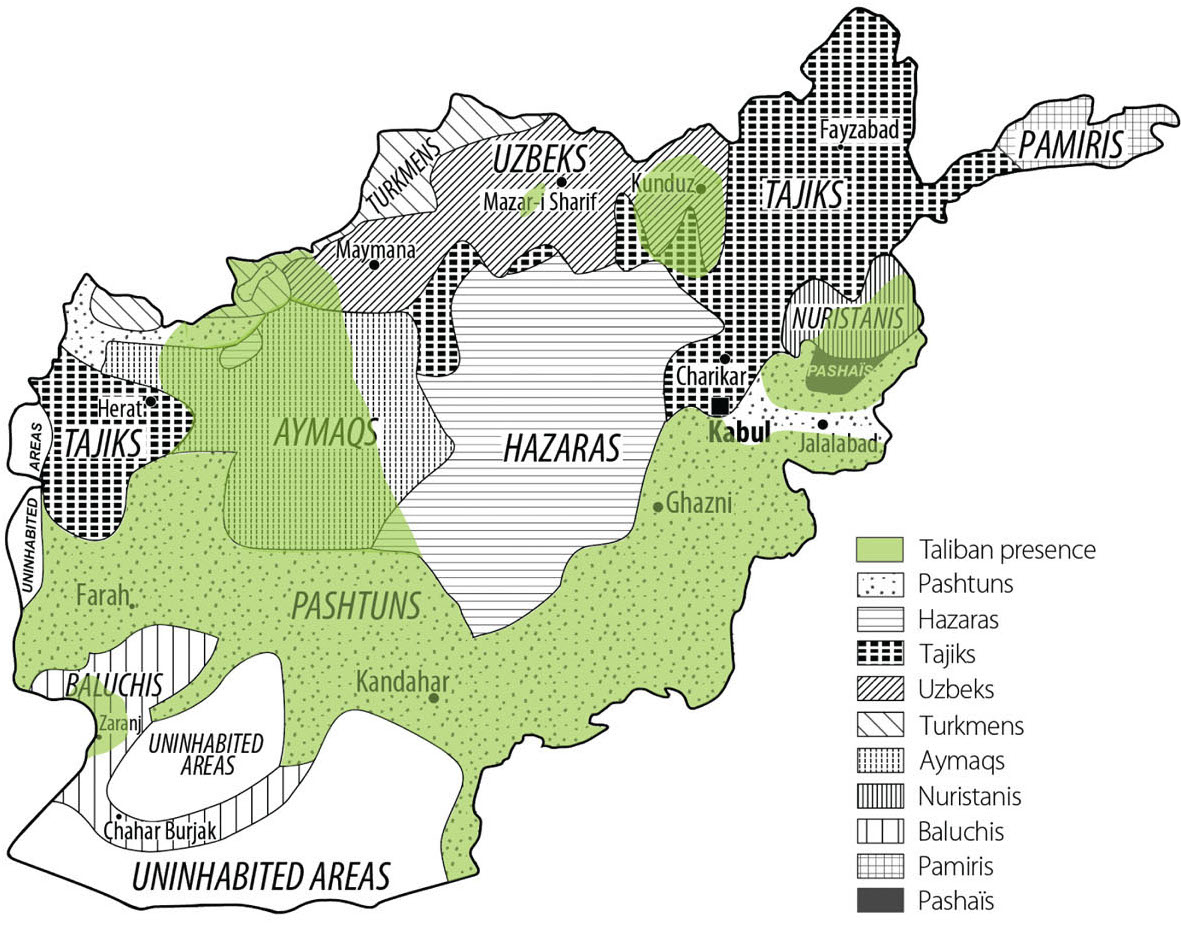
    This is to underscore the degree to which Afghanistan’s current war (the war that began when the US and allies invaded in 2001, not the 1979 to 1989 war against the Soviets or the civil wars from 1989 to 2001) is and is not about ethnicity. The Taliban does very broadly, but not exclusively, overlap with the Pashtuns in the south and east. That’s especially important since there are so many Pashtuns just across the border in Pakistan, where the Taliban have major bases of operation. But there are rebel groups besides the Taliban, not all of which are Pashtun. Generally, though, the north of the country is stabler and less violent than the south or east.

  4. The most important parts of the Afghan War, in one map

    The most important parts of the Afghan War, in one map

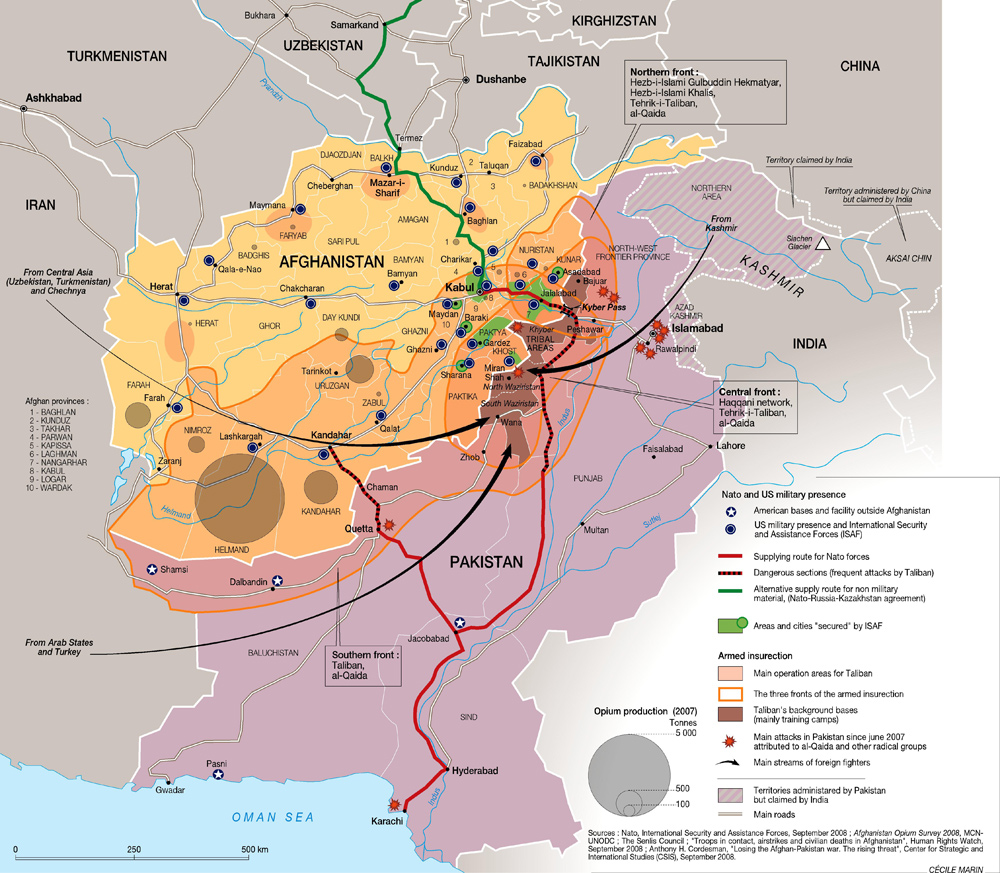
    The Afghanistan War is extremely complicated, but this map does a remarkable job of capturing the most important components: 1) the Taliban areas, in orange overlay; 2) the areas controlled by the US and allies, in depressingly tiny spots of green; 3) the major Western military bases, marked with blue dots; 4) the areas of opium production, which are a big source of Taliban funding, in brown circles, with larger circles meaning more opium; 5) the supply lines through Pakistan, in red, which Pakistan has occasionally shut down and come under frequent Taliban attack; 6) the supply line through Russia, which requires Russian approval. If this map does not depress you about the prospects of the Afghan War, not much will.


Saudi Arabia and Oil

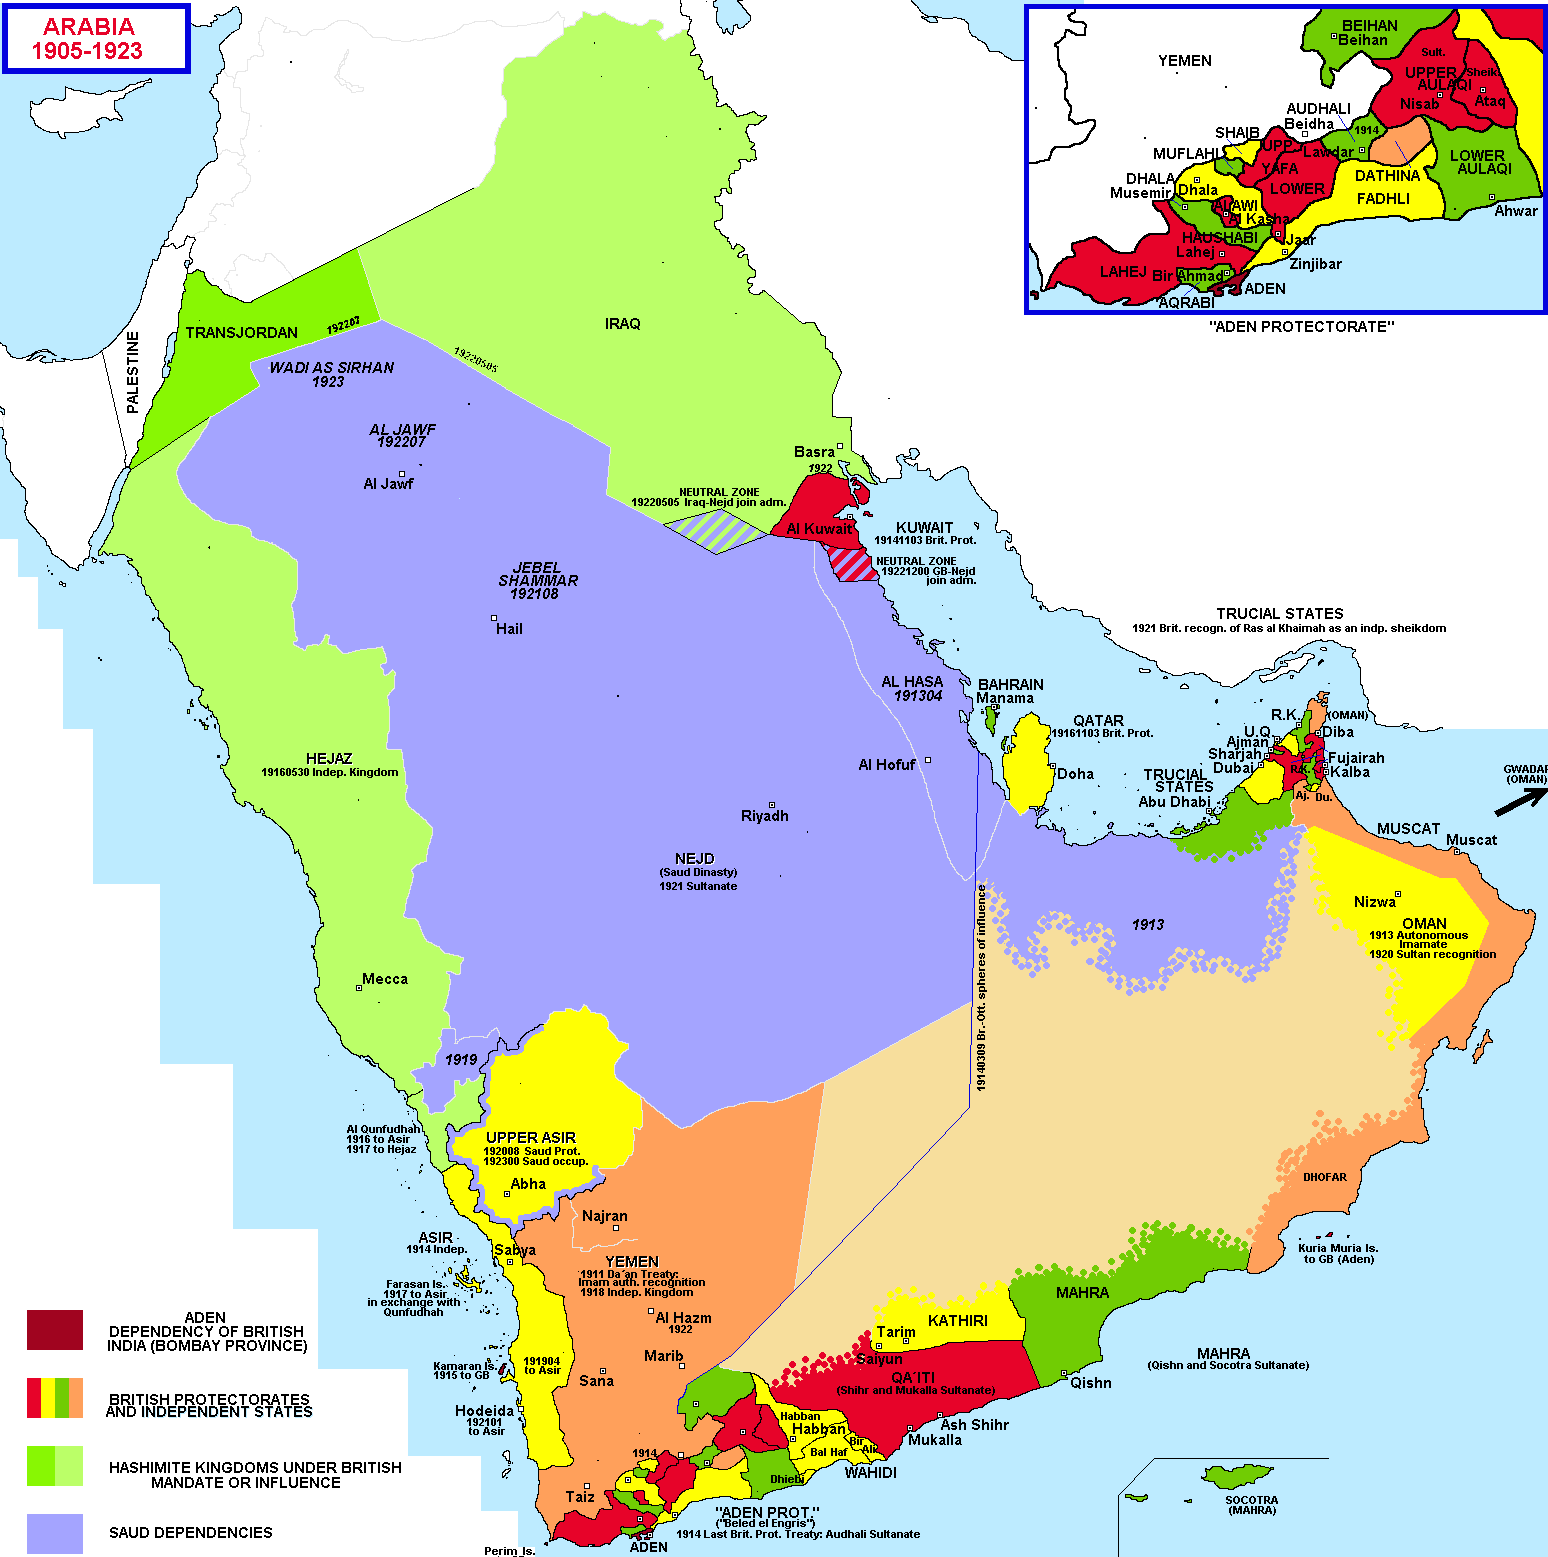
  1. What Saudi Arabia and its neighbors looked like 100 years ago

    What Saudi Arabia and its neighbors looked like 100 years ago

    The Arabian peninsula has a very, very long history, and the Saudi family has controlled much of it since the 1700s. But to understand how the peninsula got to be what it is today, go back about a 100 years to 1905. The Saudis at that point controlled very little, having lost their territory in a series of wars. The peninsula was divided into lots of little kingdoms and emirates. The Ottoman Empire controlled most of them, with the British Empire controlling the southernmost third or so of the peninsula — that line across the middle shows how it was divided. After World War I collapsed the Ottoman Empire, the Saudis expanded to all of the purple area marked here, as the British had promised for helping to fight the Ottomans. (This deal is dramatized in the film Lawrence of Arabia). By the early 1920s, the British effectively controlled almost all of the peninsula, which was divided into many dependencies, protectorates, and mandates. But the Saudis persisted.

  2. Oil and Gas in the Middle East

    Oil and Gas in the Middle East

    The Middle East produces about a third of the world’s oil and a tenth of its natural gas. (It has a third of all natural gas reserves, but they’re tougher to transport.) Much of that is exported. That makes the entire world economy pretty reliant on the continued flow of that gas and oil, which just happens to go through a region that has seen an awful lot of conflict in the last few decades. This map shows where the reserves are and how they’re transported overland; much of it also goes by sea through the Persian Gulf, a body of water that is also home to some of the largest reserves in the region and the world. The energy resources are heavily clustered in three neighboring countries that have historically hated one another: Iran, Iraq, and Saudi Arabia. The tension between those three is something that the United States, as a huge energy importer, has been deeply interested in for years: it sided against Iran during the Iran-Iraq war of the 1980s, against Iraq when it invaded Kuwait and threatened Saudi Arabia in the 1990s, again against Iraq with the 2003 invasion, and now is supporting Saudi Arabia in its rapidly worsening proxy war against Iran.

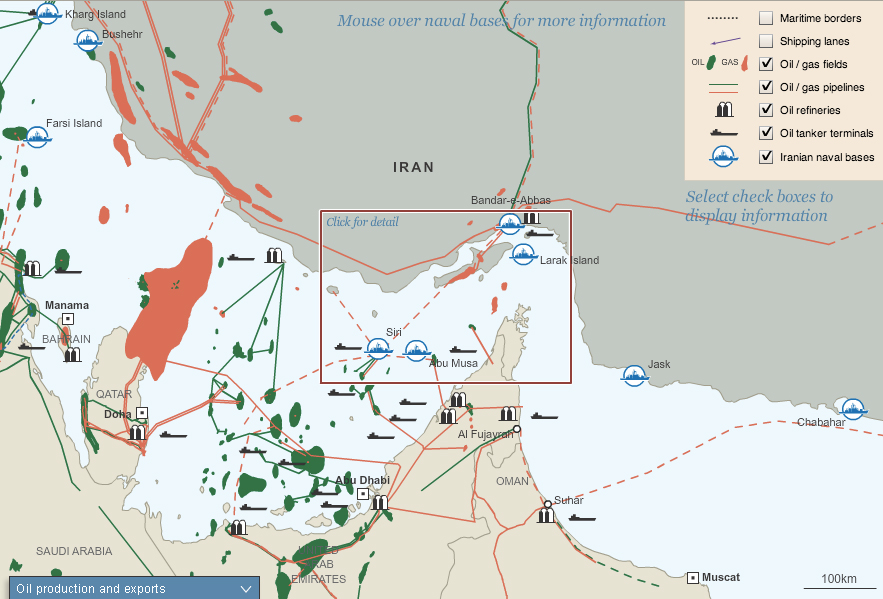
  3. Oil, trade, and militarism in the Strait of Hormuz

    Oil, trade, and militarism in the Strait of Hormuz

    The global economy depends on this narrow waterway between Iran and the Arabian Peninsula. Ever since President Jimmy Carter issued the 1980 “Carter Doctrine,” which declared that the US would use military force to defend its access to Persian Gulf oil, the little Strait of Hormuz at the Gulf’s exit has been some of the most heavily militarized water on earth. The US installed a large naval force, first to protect oil exports from the brutal Iran-Iraq War of the 1980s, then to protect them from Saddam Hussein in the 1990s Gulf Wars, and now to protect them again from Iran, which has gestured toward shutting down oil should war break out against Israel or the US. As long as the world runs on fossil fuels and there is tension in the Middle East, there will be military forces in the Strait of Hormuz.

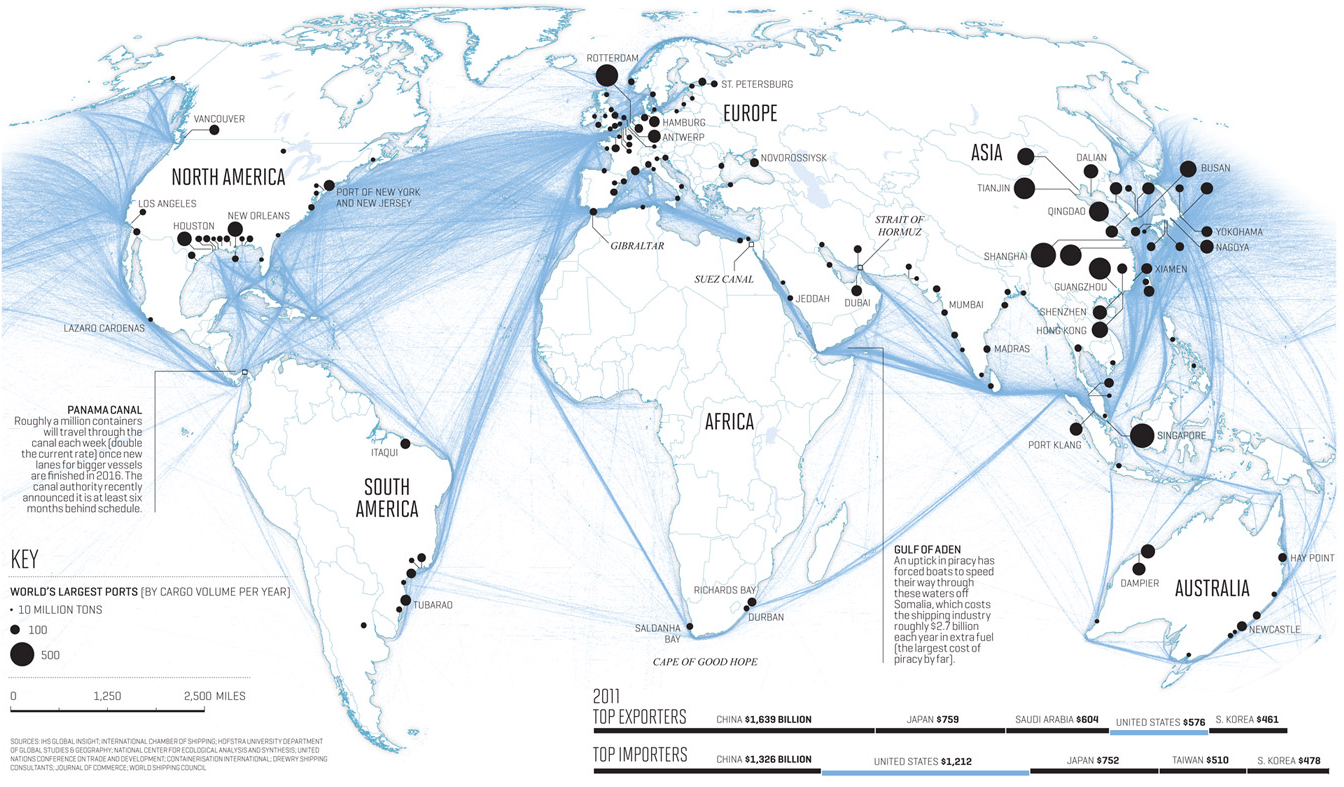
  4. Why Egypt’s Suez Canal is so important for the world economy

    Why Egypt’s Suez Canal is so important for the world economy

    The Suez Canal changed everything. When Egypt opened it in 1868, after ten years of work, the 100-mile, man-made waterway brought Europe and Asia dramatically and permanently closer. The canal’s significance to the global order was so immediately obvious that, shortly after the British conquered Egypt in the 1880s, the major world powers signed a treaty, which is still in force, declaring that the canal would forever be open to trade and warships of every nation, no matter what. Today, about eight percent of all global trade and three percent of global energy supply goes through the canal.


Iraq and Libya

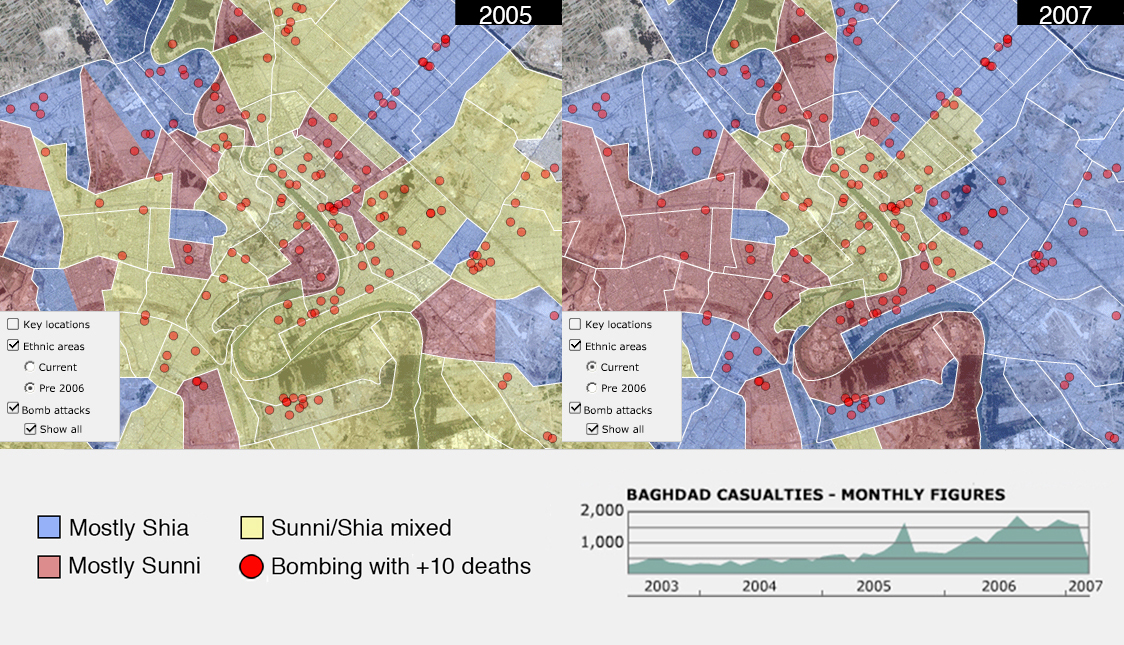
  1. The ethnic cleansing of Baghdad during the Iraq War

    The ethnic cleansing of Baghdad during the Iraq War

    BBC

    The ethnic cleansing of Baghdad during the Iraq War

    There are few grimmer symbols for the devastation of the Iraq War than what it did to Baghdad’s once-diverse neighborhoods. The map on the left shows the city’s religious make-up in 2005. Mixed neighborhoods, then the norm, are in yellow. The map on right shows what it looked like by 2007, after two awful years of Sunni-Shia killing: bombings (shown with red dots), death squads, and militias. Coerced evictions and thousands of deaths effectively cleansed neighborhoods, to be mostly Shia (blue) or mostly Sunni (red). Since late 2012, the sectarian civil war has ramped back up, in Baghdad and nationwide.

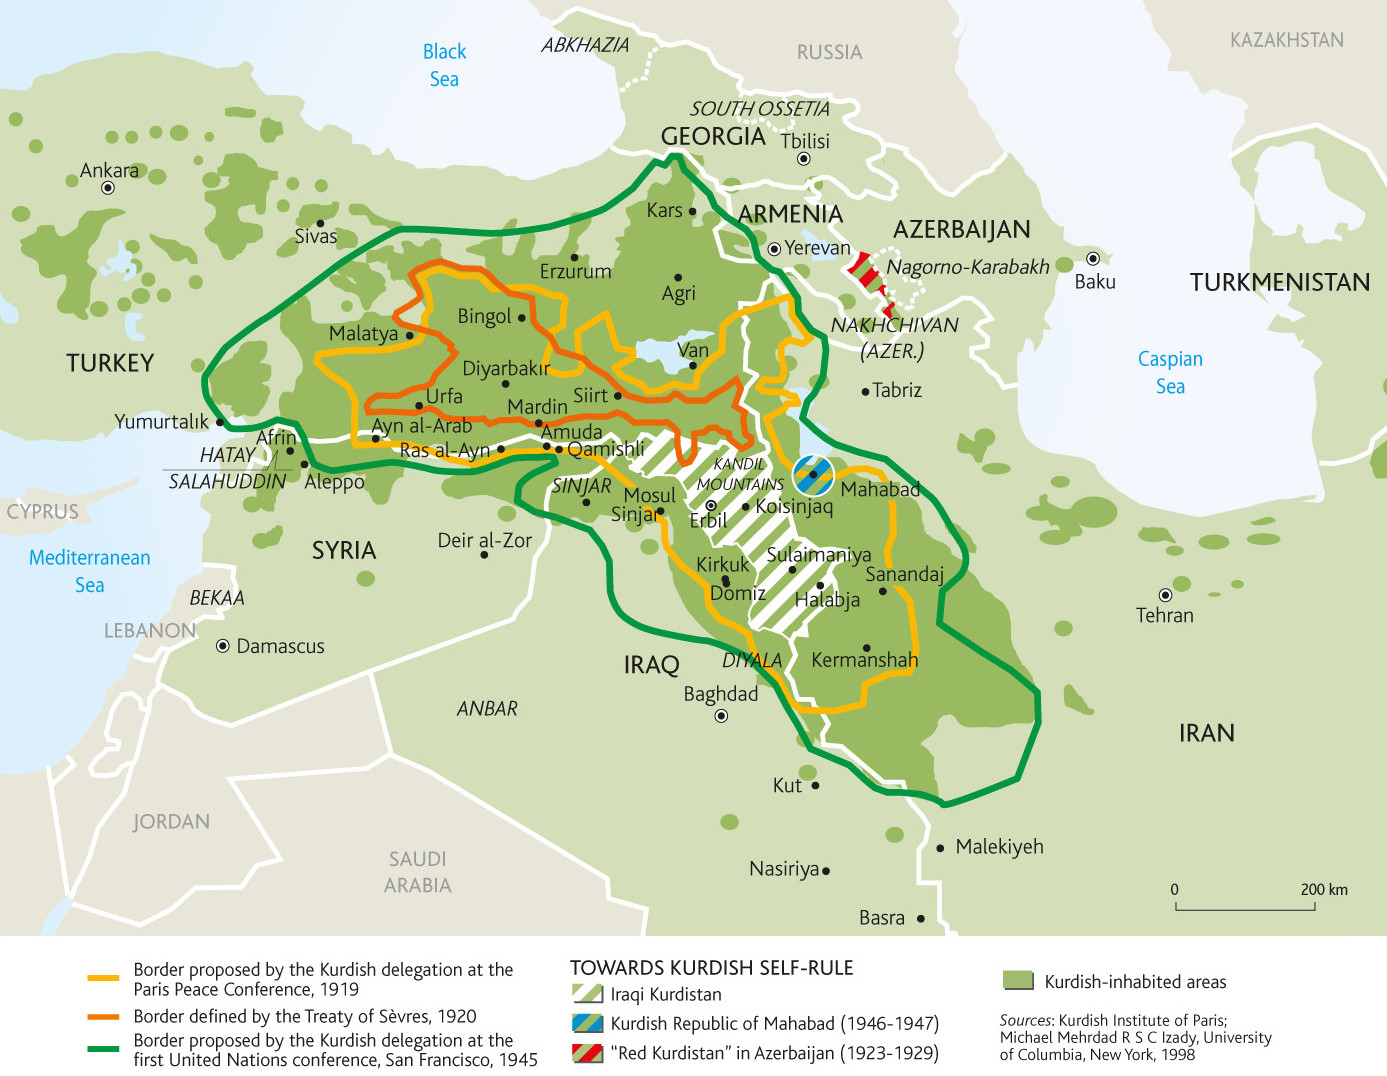
  2. Where the Kurds are and what Kurdistan might look like

    Where the Kurds are and what Kurdistan might look like

    The ethnic group known as Kurds, who have long lived as a disadvantaged minority in several Middle Eastern countries, have been fighting for a nation of their own for a long time. This map shows where they live in green overlay, and the national borders that they have proposed on three separate occasions, all of them failed. The Kurds have fought many armed rebellions, including ongoing campaigns in Syria and Turkey, and suffered many abuses, from attempted genocides to official bans on their language and culture. Their one major victory in the last century has been in Iraq: as a result of the US-led invasion that toppled Saddam Hussein, Iraqi Kurds have autonomous self-rule in Iraq’s north.

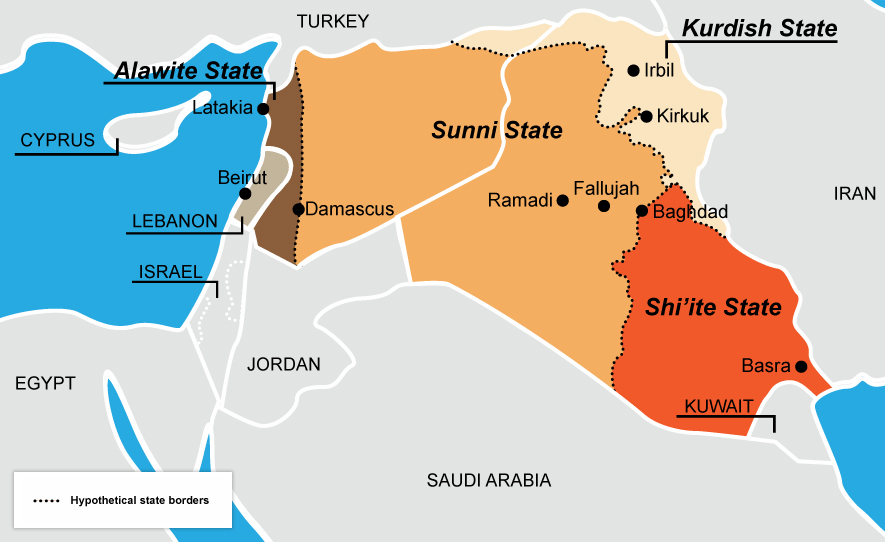
  3. A hypothetical re-drawing of Syria and Iraq

    A hypothetical re-drawing of Syria and Iraq

    This is an old idea that gets new attention every few years, when violence between Sunnis and Shias reignites: should the arbitrary borders imposed by European powers be replaced with new borders along the region’s ever-fractious religious divide? The idea is unworkable in reality and would probably just create new problems. But, in a sense, this is already what the region looks like. The Iraqi government controls the country’s Shia-majority east, but Sunni Islamist extremists have seized much of western Iraq and eastern Syria. The Shia-dominated Syrian government, meanwhile, mostly only controls the country’s Shia- and Christian-heavy west. The Kurds, meanwhile, are legally autonomous in Iraq and functionally so in Syria. This map, then, is not so much just idle speculation anymore; it’s something that Iraqis and Syrians are creating themselves.

  4. How Libya’s 2011 War changed Africa

    How Libya’s 2011 War changed Africa

    Noble as the cause was, the destruction of Moammar Qaddafi’s dictatorship by a spontaneous uprising and a Western intervention has just wreaked havoc in Africa’s northern half. This map attempts to show all that came after Qaddafi’s fall; that it is so overwhelmingly complex is precisely the point. The place to center your gaze is the patterned orange overlay across Libya, Algeria, Mali, and Niger: this shows where the Tuaregs, a semi-nomadic ethnic minority group, lives. Qaddafi used Libya’s oil wealth to train, arm, and fund large numbers of Tuaregs to fight the armed uprising in 2011. When he fell, the Tuaregs took the guns back out with them to Algeria and Mali, where they took control of territory. In Mali, they led a full-fledged rebellion that, for a time, seized the country’s northern half. Al-Qaeda moved into the vacuum they left, conquering entire towns in Mali and seizing fossil fuel facilities in Algeria. Criminal enterprises have flourished in this semi-arid belt of land known as the Sahel. So have vast migration routes, of Africans looking to find work and a better life in Europe. At the same time, armed conflict is getting worse in Nigeria and Sudan, both major oil producers. Qaddafi’s fall was far from the sole cause of all of this, but it brought just the right combination of disorder, guns, and militias to make everything a lot worse.


Points of Light

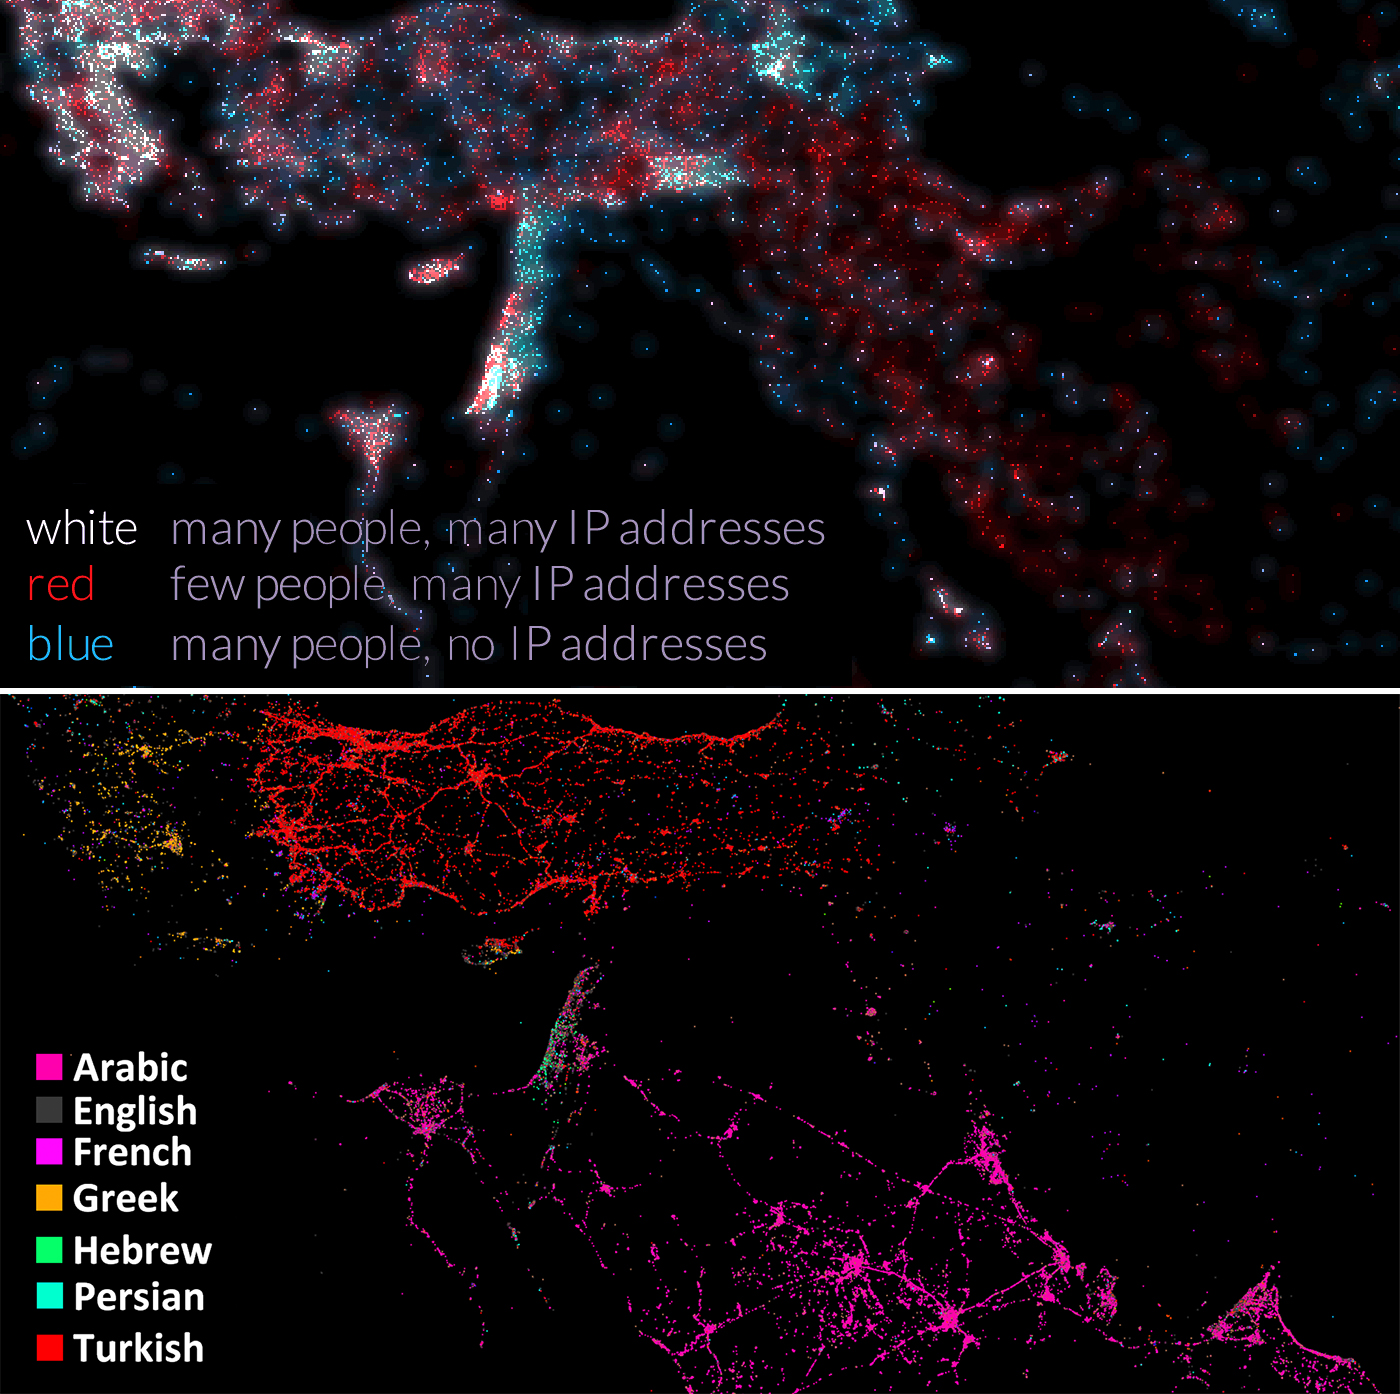
  1. Mapped by Internet connections (top) and by tweets (bottom)

    Mapped by Internet connections (top) and by tweets (bottom)

    Top map: Gregor Aisch; bottom map: Eric Fischer

    Mapped by Internet connections (top) and by tweets (bottom)

    These maps are two ways of looking at a similar thing: the digitalization of the Middle East. The map on top is actually a population map: the dots represent clusters of people, but the dots are colored to show how many IP addresses there are, which basically means how many internet connections. The blue areas have lots of people but few connections: these are the poorer areas, such as Yemen, Pakistan, and Syria. White and red show where there are lots of connections: rich countries like Israel and the United Arab Emirates, but also parts of Egypt and Iran and Turkey, the populations of which are increasingly wired, to tremendous political consequence. The map on the bottom shows tweets: lots of dots mean lots of tweets from that area. They’re colored by language. Notice where these two maps are different: Iran has lots of internet connections but almost no tweets; like Facebook, Twitter has been banned since the 2009 anti-government protests. Saudi Arabia, on the other hand, lights right up: its modestly sized population is remarkably wired. The significance of that became clear, for example, with the 2012 and 2013 social media-led campaigns by Saudi women to drive en masse, in protest of the country’s ban on female drivers. The consequences of internet access and lack of access will surely continue to be important, and perhaps hard to predict, for the region.

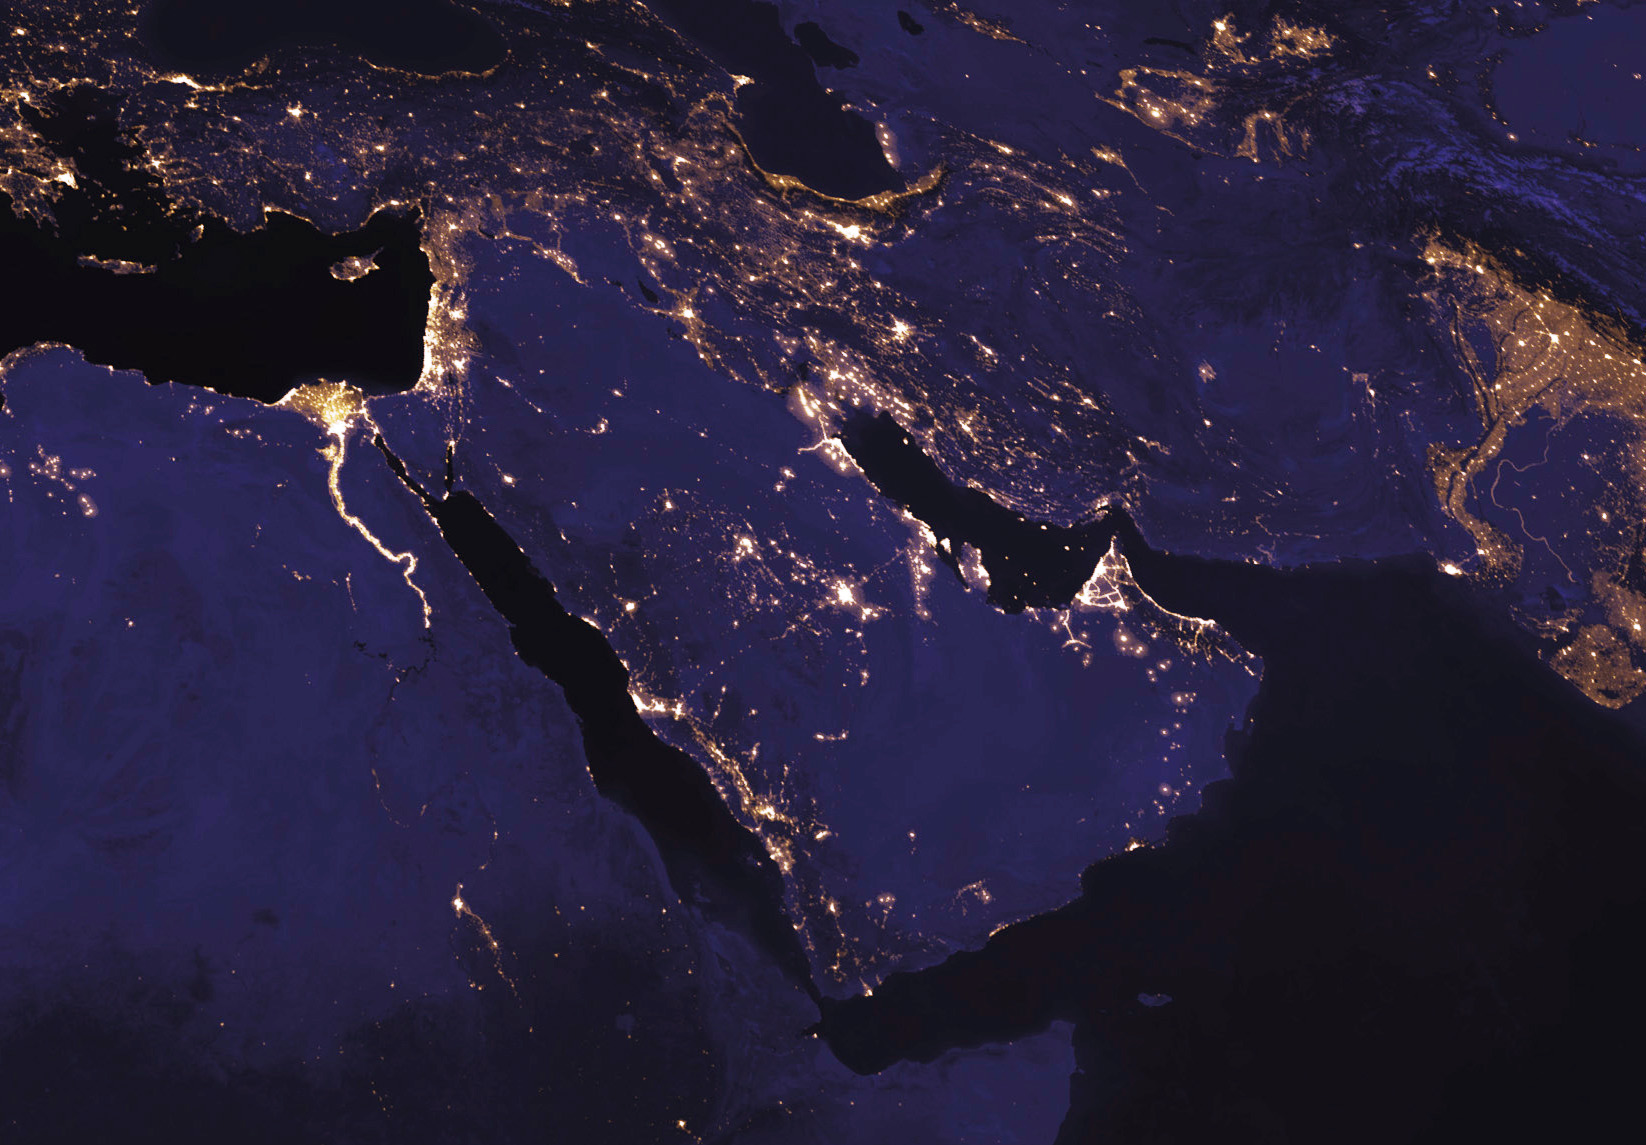
  2. The Middle East at night from space

    The Middle East at night from space

    I’m concluding with this map to look at the region without political borders, without demographic demarcations of religion or ethnicity, without markers of conflict or oil. Looking at the region at night, from space, lets those distinctions fall away, to see it purely by its geography and illuminated by the people who call it home. The lights trace the rivers that have been so important to the Middle East’s history, and the world’s: the Nile in Egypt, the Tigris and Euphrates that run through Iraq and Syria, the Indus in Pakistan. They also show the large, and in many cases growing, communities along the shores of the Persian Gulf, the eastern Mediterranean, and the southern end of the Caspian. It’s a beautiful view of a really beautiful part of the world.

$$ Taken Out of Veteran’s Pockets for Visa Program


But we are still in Afghanistan and will be there for many years…where is the United Nations? What role does the refugee resettlement program have in this so as not to penalize veterans?

The Senate Grew A Special Visa Program With Money Taken Out Of Veterans’ Pockets

DailyCallerNewsFoundation: The Senate used money from benefit cuts to military veterans in the 2016 budget to pay for the resettlement of an additional 3,000 Afghan interpreters in the United States. A dispute over a similar pay-for plan is behind the Judiciary Committee’s refusal to expand the program again in the 2017 budget.

The Special Immigrant Visa program allows Afghan interpreters who aide the U.S. government to get out of harm’s way by resettling in the United States, and last year the Senate authorized a major expansion of the program. The $336 million price tag of the expansion fell on U.S. military veterans in the form of increased pharmacy co-pays, The Daily Caller News Foundation has learned.

“That’s bullshit,” former Army combat veteran Alex Plitsas told TheDCNF. “Military families shouldn’t be paying for the SIV program through a pseudo tax. The program should be funded outright because of the service our interpreters rendered. This is infuriating.”

Last year’s defense bill increased co-pays for military families, saving the government about $1.5 billion, according to the Congressional Budget Office (CBO). A portion of the money saved was used to pay for the extra Afghan visas, a spokesman for the Armed Services Committee told TheDCNF, although the bulk of the money went elsewhere. Budget caps require lawmakers offset increases in spending with budget cuts.

Plitsas added: “They went this route to avoid having to cut any of the service budgets (army, navy, etc) that’s why I’m calling this a pseudo tax on military families. More importantly, this is a visa program overseen by State, why the hell isn’t this coming out of state’s budget?”

The committee spokesman told TheDCNF most of the $1.5 billion went back to the Treasury to pay down the debt, and some of the savings were used to offset the cost of expanding retirement benefits in other ways for “hundreds of thousands” of service members. Those changes will cost the government about $1 billion over the next ten years, according to the CBO.

Senators voted for the co-pay increases on the merits of the policy and were not treating it as a pay-for, the spokesman added. The increase was included for “no other reason” than to address rising pharmacy costs and to encourage veterans to use drugs available for free through military treatment centers rather than through pharmacies, the spokesman stressed.

Nevertheless, in making the decision to offset the visa expansion with funds from the co-pay increase, the Senate took hundreds of millions of dollars off the table that could have gone to support veterans or been used for some other purpose. There’s no reason the money has to come out of the defense budget, especially since there is overlap in jurisdiction with the State Department’s control of visa programs.

A disagreement between Senate Republicans over a similar pay-for plan this year has kept another expansion of the program out of the 2017 defense bill, a GOP Senate aide told TheDCNF. One proposal to offset the cost by taking money out of the State Department’s budget was floated and rejected.

“I’ve been told by multiple sources that they’re trying to use the co-pay hike to pay for the visa increase again this year,” the aide said. “With so much wasteful government spending that should be cut, it is befuddling how some in Congress are so eager to put military and veteran benefits on the chopping block.”


Sens. John McCain and Jeanne Shaheen are vocally pushing for more visas, on top of the 7,000 already allocated through Fiscal Year 2017. But neither has publicly addressed how the increase would be paid for. The CBO estimates the proposed increase would bring the cost of the program up to $446 million over the next ten years, from its current cost of $336 million.

Shaheen did not respond to multiple requests for comment. McCain’s office directed TheDCNF to the Armed Services Committee.

“Senate Republicans recognize the contribution of certain Afghan citizens who have been helpful to our war effort,” a spokesman for Republican Sen. Roger Wicker who sits on the Armed Services Committee, told TheDCNF. “However, any bill to expand the SIV program should contain acceptable offsets and go through regular order through the Judiciary Committee.”

According to Matt Zeller, a former U.S. Army infantry officer and CEO of No One Left Behind, there are approximately 10,400 former Afghan interpreters in the program’s application pipeline. Without an increase in visas, as many as 6,400 applicants will be left in Afghanistan, given the program currently only allows for 4,000 visas per year.

The program has a final chance at seeing an increase in funding once the National Defense Authorization Act hits the Senate floor this week, allowing supporters like McCain the opportunity to put forth an amendment.

***** Meanwhile Afghanistan is hardly stable or a conflict where victory is claimed.


17 May 2016 – The United Nations humanitarian wing has reported that since the beginning of the year, about 1,000 Afghans have fled their homes every day due to fighting, and aid workers are struggling to meet the needs of those on the run from hard hit provinces such as Kunduz, Herat and Uruzugan.

According to a report compiled in April and newly released by the UN Office for the Coordination of Humanitarian Affairs (OCHA), the main humanitarian story of the year is the very large number of people fleeing from their homes to save their lives, with about 118,000 on the move in the first four months of the year.

Specifically in Kunduz, OCHA said springtime in the north eastern province “has been tragically filled with conflict and suffering,” leading to an extraordinary displacement of more than 22,400 people. Civilians appear to be caught in the cross-fire between a “spring offensive” launched by non-State actors and subsequent countermeasures put in motion by Government forces.

Fleeing for their lives, 14, 000 people were forced from Kunduz city to remote areas where the conflict is most active. The insecure environment and access constraints created severe challenges in the delivery of humanitarian assistance.

As the violence continued after mid-April, families were forced to flee and seek safety with family members and neighbours who opened their doors to offer a haven in the midst of chaos. “When we conducted the initial needs assessments, as many as six families were living in one house,” reported Syed Zaheer, OCHA Humanitarian Affairs Officer, who helped lead the joint assessment mission.

The security situation in Kunduz province continued to rapidly deteriorate, OCHA said. And as displacement swelled, aid agencies prioritized urgent humanitarian assistance to the 7,000 displaced people, however in many cases one of the biggest challenges is access to reaching the most vulnerable families in need.

According to the report, as the battle raged on for territorial control in all seven districts of Kunduz province, families were further displaced to more remote and insecure areas where humanitarian agencies continue to struggle to gain access.

Although physical access to displaced families remains a challenge due to IEDs, military operations and road closures, humanitarian agencies managed to deliver much needed food, nutritional support, emergency shelter, non-food items (NFIs) and health care.

“The displaced families in Kunduz have endured repeated suffering – some displaced two and three times – raising their vulnerability,” explained OCHA Head of Sub-Office, Gift Chatora. “We have seen the detrimental consequences when displaced families are inaccessible to humanitarian assistance, children miss out on education, nutrition and basic health care while parents lose their livelihoods and means to provide for their families.”


Cheat Sheet on the Defense Authorization Bill

Guantanamo Bay:

Since Congress specifically provided the president with the authority to acquire the U.S. Naval Station at Guantanamo Bay, Chairman Royce’s legislation asserts Congress should have to approve any decision to give it away, which certainly shouldn’t happen with this communist and hostile Cuban government.

As Chairman Royce has said, “the U.S. Naval Station at Guantanamo Bay is critical to our national security and humanitarian operations that have saved countless lives.  We must protect against executive overreach during this administration, and the next, and the next.”

****

DefenseNews/WASHINGTON — Responding to fears the US military’s technological superiority is at risk, the Senate Armed Services Committee advanced an annual defense policy bill that would open competition to commercial industry, seen as a spur to innovation and cost-efficiency.

The marquee change, if the SASC’s version of the 2017 National Defense Authorization Act passes Congress and is signed by the president, is the proposed closure of the Pentagon’s chief weapons buyer’s office and reassignment of its duties to two new defense undersecretaries for innovation and acquisitions management. It also contains far-reaching language to curb a major concern of SASC Chairman John McCain: cost-plus contracts.

In February, McCain made headlines when he vowed not to authorize the Air Force’s Long Range Strike-Bomber so long as it was procured using a cost-plus contract. The SASC bill does not check that box, but it promises a broader impact, to discourage cost-plus contracts, where a contractor is paid for all of its allowed expenses to a set limit, plus additional payment to allow for a profit.

In a background briefing on Monday, a senior committee aide — who likened DoD’s dependence on cost-plus to a drug addiction — said the venerable contracting vehicle has its uses, but too often fuels cost overruns and is out of step with the way commercial firms in Silicon Valley and elsewhere do business. Fixed-price contracts, on the other hand, give firms an incentive to work as efficiently as possible to maximize their profits.

“All of this reform is because the Cold War has ended, and post-Cold War, American technological military dominance is over, and not only can our adversaries see that they can replicate what we can do with the traditional defense marketplace, they are seeing there is a lot of technology in the commercial marketplace,” said the aide. “If they can access that quicker than we can access that and derive defense products from that new base, they can potentially leap ahead of us.”

The bill, which the SASC voted to advance to the full Senate last week, contained 130 acquisition reform provisions — a continuation of the committee’s work last year. Some language aimed at curbing bid protests would mean any large firms that lose a protest they file would have to pay a penalty, while other provisions would curb barriers to entry for so-called non-traditional firms.

Complex, DoD-unique cost-accounting standards geared toward the minutiae of cost-plus contracts have not only created a barrier for commercial firms but an auditing backlog within DoD that is preventing 30- and 40-year-old contracts from being closed, the Senate aide said.

To address this, the bill would set up a new accounting standards board aimed at pro-competition changes.

“We’re looking to move more and more companies away from that [accounting standard], and make sure the way accounting looks in the department is more and more commercial-like, so companies aren’t creating new accounting systems just to deal with the Department of Defense,” the aide said.

For a company like SpaceX, which is developing its own rocket engine, assessing a reasonable price is a tricky proposition, the Senate aide said. For DoD, which uses cost-plus contracting, it’s the agreed-upon cost of production plus a reasonable profit, while for a commercial firm, it’s about what the market will bear.

“In the fixed-price world, your profit margin is about how well you execute,” the aide said. “A government contractor is more like a utility, and the argument is who’s more innovative, someone with a high margin or a public utility?”

A four-year pilot program established by the bill would exact fees to fund advanced prototypes purchased through fixed-price contracts. The penalties would amount to, for a cost-plus technology development contract, an additional 1 percent of DoD’s year-to-year obligation, and on a procurement contract, 2 percent. This requirement would begin in 2018.

Among other measures, the bill would establish a phased-in, internal approval process for cost-plus contracts, which by 2020 would apply to any cost-plus contract over $5 million.

Ultimately, the Defense Department will not be kept from using cost-plus contracts where needed, particularly for defense-unique platforms like, say, a nuclear submarine. However, the aide stopped short of saying the proposed bill, if enacted, would have precluded the current acquisition strategy for the bomber. Instead, the bill reinforces the signal that arrangements of this type will face new scrutiny.

“We would hope the department would look at that in a different manner,” the aide said. “Ultimately it will be discretionary. We don’t want to impinge on the [defense] secretary.”

Bid Protests

Acknowledging the value of the bid protest process as a policing function for defense acquisitions, the aide said it also creates a risk-averse culture among acquisitions officials that is stymying innovation. Hence the proposed “loser pays” provision.

That language would apply to a protest-losing company with more than $100 million in annual revenue, or an incumbent firm that protests the loss of a contract, keeps the business via a bridge contract and then loses. The penalty would equal the Government Accountability Office’s cost to process the protest.

What’s driving the language, the Senate aide said, is that Wall Street analysts have begun to tout protests as being part of the fiduciary responsibility of a losing firm. Members of the committee fear that this thinking, unchecked, will fuel a boom in protests.

Another concern was that the risk aversion among contracting officers was leading to contract awards for lowest-price, technically acceptable, offerings over offerings that were neither the most innovative or the best value for the government.


Table 1. FY2017 National Defense Authorization Act (H.R. 4909)

amounts in millions of dollars of discretionary budget authority

Bill Title Budget Request HASC reported bill (H.R. 4909) Senate committee- reported bill Conference Report
National Defense Base Budget
Procurement 101,971.6 103,062.3
Research and Development 71,391.8 71,629.8
Operation and Maintenance 171,318.5 169,325.3
Military Personnel 135,269.2 134,849.8
Defense Health Program and Other Authorizations 36,557.0 37,025.6
Military Construction/Family Housing 7,444.1 7,694.0
Subtotal: DOD Base Budget 523,952.1 523,586.9
Atomic Energy Defense Activities 19,240.5 19,512.1
Other Defense-Related Agencies 211.0 300.0
TOTAL: National Defense Budget Function (050) Base Budget 543,403.6 543,399.0
DOD OCO Budget 58,798.0 58,793.5
GRAND TOTAL: FY2017 NDAA 602,201.6 602,192.5