Libya and Hillary’s team investment operation in post Qaddafi Libya
When Ambassador Cretz was expelled from Libya, he was later assigned to Ghana. As of this week, he is out of Ghana, allegedly retiring. I would suggest he is in the belly of the beast with the Hillary team, but I can’t prove anything other than a gut feeling.
The Blumenthal and Clinton emails explain that Qaddafi’s demise was imminent so the financial investment opportunities in the pipeline for Libya were about to gain traction that included Qatar, where Hillary fully collaborated with the dynasty there.
Last month, I authored a piece on the little known agenda Hillary, Blumenthal and Drumheller along with the Qataris were working on, where Tripoli and Benghazi were to be the new Middle East version of New York’s 5th Avenue.
Before Qaddafi and just after Qaddafi, note there was a luxury project underway. The Libyan-Qatari Company declared recently the laying of the foundation stone of “The Waterfront” project, for the construction of a luxurious residential complex and resort near Tripoli, expected to be completed by the end of 2012.
Many interesting details are noted here.
Pay to Play…literally…
This poses another question to bubble to the surface when the matter of Bill Clinton, the Foundation, Qatar and FIFA all come into the same sentence.
In 2014, more came to light when one pays attention to foreign press releases that speaks about the future of Libya at the hands of Qatar and other European investors.
Qatar in Libya, 2011-present
Qatar’s bold support for the 2011 Libyan revolution was a striking example of the small state’s assertiveness in the external realm. One of the most symbolic moments of this support came when rebels in Libya overran Qadhafi’s Tripoli headquarters in August 2011 and briefly raised the maroon and white Qatari flag over the compound. That day, Mahmoud Jibril, the head of Libya’s provisional governing authority, the National Transitional Council (NTC), publically thanked Qatar for its support of the Libyan revolution.
While Qatar’s role in Libya was critical in backing the revolution, the emirate had also dealt with the Qadhafi regime prior to 2011. Indeed, Qatari investments in Libya amounted to USD 10 billion before the start of the civil war. During that time, Qatari companies won construction contracts for the development of residential and entertainment complexes in and around Tripoli based on a joint venture between the Libyan Economic and Social Development Fund and the Qatari Diar Real Estate Investment Company, a branch of the state-run Qatar Investment Authority.
Apparently seeing the inevitable demise of Qadhafi, in March 2011, Qatar nevertheless helped to rally support within the Arab League for the UN Security Council resolutions authorizing NATO intervention in Libya. It was the first Arab state to recognize the National Transition Council (NTC).viii Qatar went so far as to participate in the air war with its own military aircraft (six Mirage fighter jets), and elite Qatari troops participated in the liberation of Tripoli. By the end of the conflict, Qatar had contributed USD 400 million to the rebels (including an estimated twenty thousand tons of Qatari weapons and equipment), trained fighters, set up a TV station in Doha, helped Libya keep its oil exports flowing, and provided political and organizational support, especially to militias aligned with its vision and interests.
Doing Business with Middle East Operations Blocked by Treasury
What is very interesting is in November of 2011, several of the investment groups were removed from the Treasury Department’s special designation list of Foreign Assets Control and one in particular was the Libyan Economic and Social Development Fund.
Then enter more on Qatar. Now there is a Tourism company in Libya? The Qatar Diar a worldwide real estate developer has grand real estate operations.
What is planned now for Libya after the Arab Spring? Back to the European investors and the collusion with Qatar. Then Rachel Ehrenfeld wrote a very good time line using names attached to the Foundation.
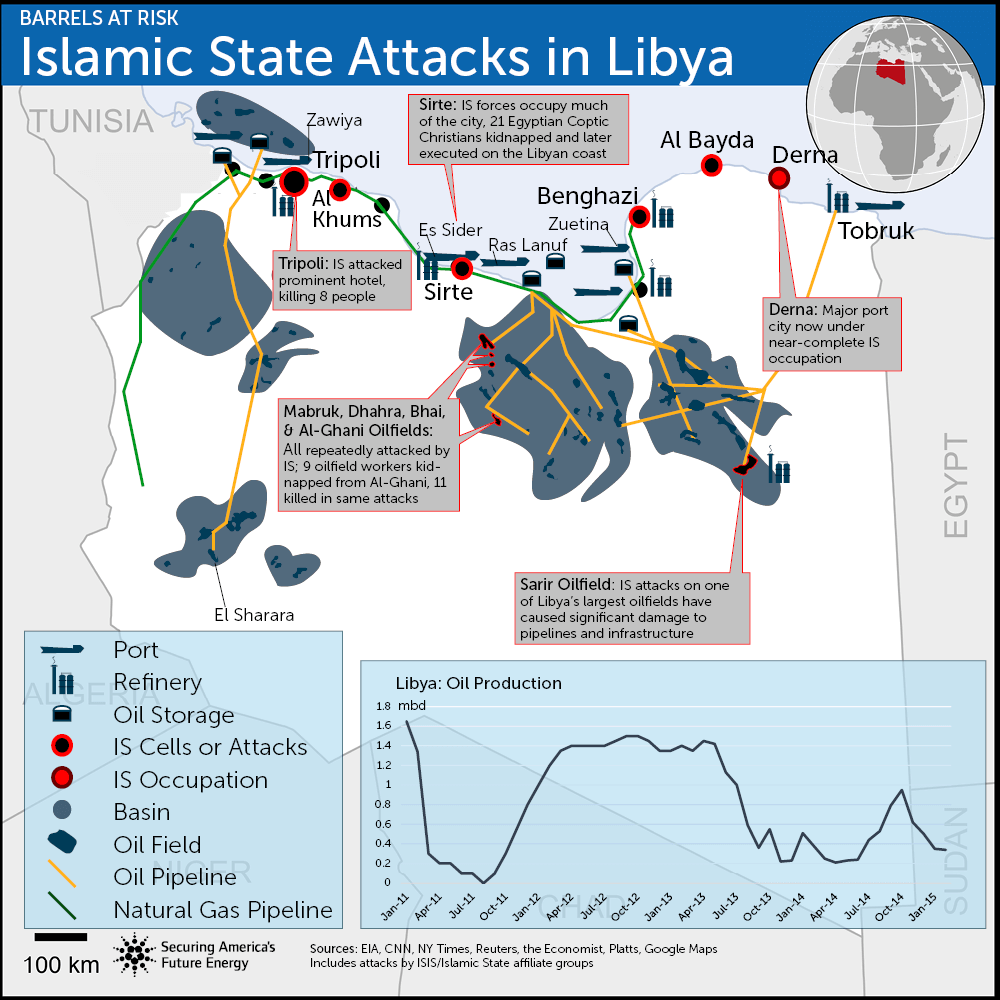
So how did or does this all work out? Not so well when ISIS has a growing footprint in Libya. Summary from The Fuse: